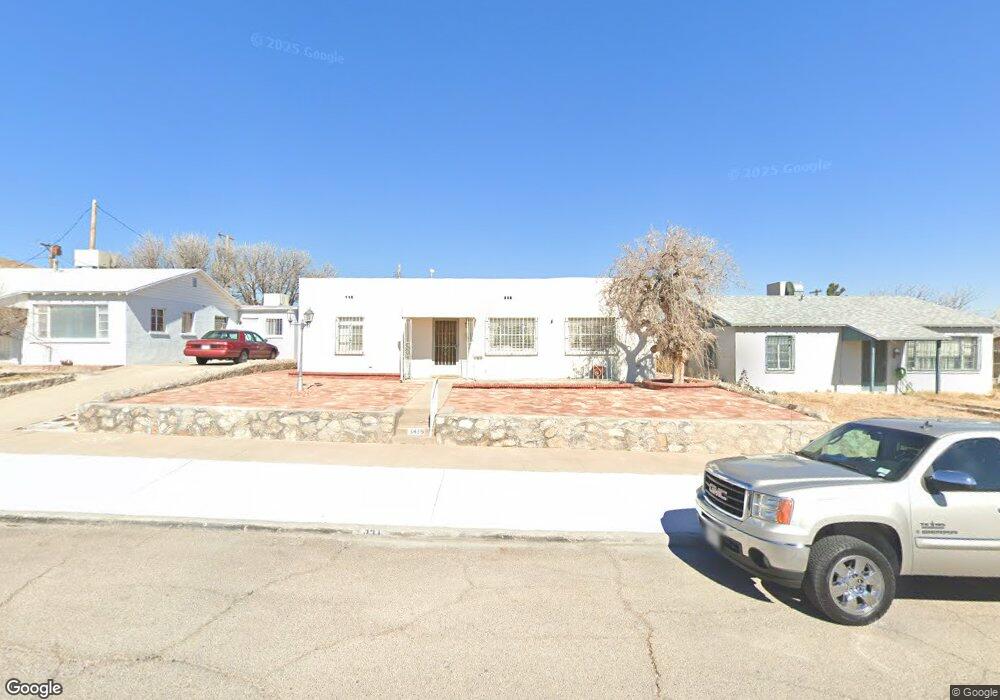
3419 Pierce Ave El Paso, TX 79930
Central NeighborhoodEstimated Value: $176,000 - $222,000
--
Bed
1
Bath
1,771
Sq Ft
$117/Sq Ft
Est. Value
About This Home
This home is located at 3419 Pierce Ave, El Paso, TX 79930 and is currently estimated at $207,370, approximately $117 per square foot. 3419 Pierce Ave is a home located in El Paso County with nearby schools including Travis Elementary School, Middle School-5 NW Middle, and Chapin High School.
Ownership History
Date
Name
Owned For
Owner Type
Purchase Details
Closed on
Dec 18, 2019
Sold by
Miranda Rene
Bought by
Miranda Patricia
Current Estimated Value
Purchase Details
Closed on
Aug 20, 2012
Sold by
Bustamante Rene
Bought by
Cortez Patricia and Miranda Rene
Home Financials for this Owner
Home Financials are based on the most recent Mortgage that was taken out on this home.
Original Mortgage
$53,825
Outstanding Balance
$8,422
Interest Rate
3.25%
Mortgage Type
FHA
Estimated Equity
$198,948
Purchase Details
Closed on
May 25, 2001
Sold by
Bustamante Rene
Bought by
Cortez Patricia
Purchase Details
Closed on
May 12, 1998
Sold by
Hammond Philip S
Bought by
Bustamante Rene and Cortez Patricia M
Home Financials for this Owner
Home Financials are based on the most recent Mortgage that was taken out on this home.
Original Mortgage
$63,650
Interest Rate
7.18%
Mortgage Type
FHA
Create a Home Valuation Report for This Property
The Home Valuation Report is an in-depth analysis detailing your home's value as well as a comparison with similar homes in the area
Home Values in the Area
Average Home Value in this Area
Purchase History
| Date | Buyer | Sale Price | Title Company |
|---|---|---|---|
| Miranda Patricia | -- | None Available | |
| Cortez Patricia | -- | None Available | |
| Cortez Patricia | -- | -- | |
| Bustamante Rene | -- | -- |
Source: Public Records
Mortgage History
| Date | Status | Borrower | Loan Amount |
|---|---|---|---|
| Open | Cortez Patricia | $53,825 | |
| Previous Owner | Bustamante Rene | $63,650 |
Source: Public Records
Tax History Compared to Growth
Tax History
| Year | Tax Paid | Tax Assessment Tax Assessment Total Assessment is a certain percentage of the fair market value that is determined by local assessors to be the total taxable value of land and additions on the property. | Land | Improvement |
|---|---|---|---|---|
| 2025 | $2,818 | $167,729 | -- | -- |
| 2024 | $2,818 | $152,481 | -- | -- |
| 2023 | $2,634 | $138,619 | $0 | $0 |
| 2022 | $3,730 | $126,017 | $0 | $0 |
| 2021 | $3,577 | $125,004 | $14,358 | $110,646 |
| 2020 | $3,201 | $104,146 | $14,358 | $89,788 |
| 2018 | $3,058 | $103,307 | $14,358 | $88,949 |
| 2017 | $2,653 | $94,172 | $14,358 | $79,814 |
| 2016 | $2,653 | $94,172 | $14,358 | $79,814 |
| 2015 | $2,644 | $102,153 | $14,358 | $87,795 |
| 2014 | $2,644 | $105,504 | $14,358 | $91,146 |
Source: Public Records
Map
Nearby Homes
- 3501 Taylor Ave
- 3501 Polk Ave
- 3312 Polk Ave
- 3010 Pierce Ave
- 3808 Johnson Ave
- 3413 Monroe Ave
- 3906 Taylor Ave
- 3104 Van Buren Ave
- 3021 Monroe Ave
- 3737 Fred Wilson Ave
- 2801 Polk Ave
- 4029 Lincoln Ave
- 3905 Monroe Ave
- 3901 Fred Wilson Ave
- 2704 Taylor Ave
- 3904 N Piedras St Unit A-B
- 3704 Mckinley Ave
- 3825 Keltner Ave
- 3423 Wickham Ave
- 3901 Mckinley Ave
- 3423 Pierce Ave
- 3415 Pierce Ave
- 3409 Pierce Ave
- 3429 Pierce Ave Unit 3431
- 3420 Truman Ave
- 3420 Truman Ave Unit 1
- 3416 Truman Ave
- 3424 Truman Ave
- 3405 Pierce Ave
- 3410 Truman Ave
- 3452 Pierce Ave
- 3454 Pierce Ave
- 3450 Pierce Ave
- 3456 Pierce Ave
- 3406 Truman Ave
- 3406 Truman Ave Unit 1
- 3401 Pierce Ave
- 4603 Byron St
- 3501 Pierce Ave
- 3404 Pierce Ave