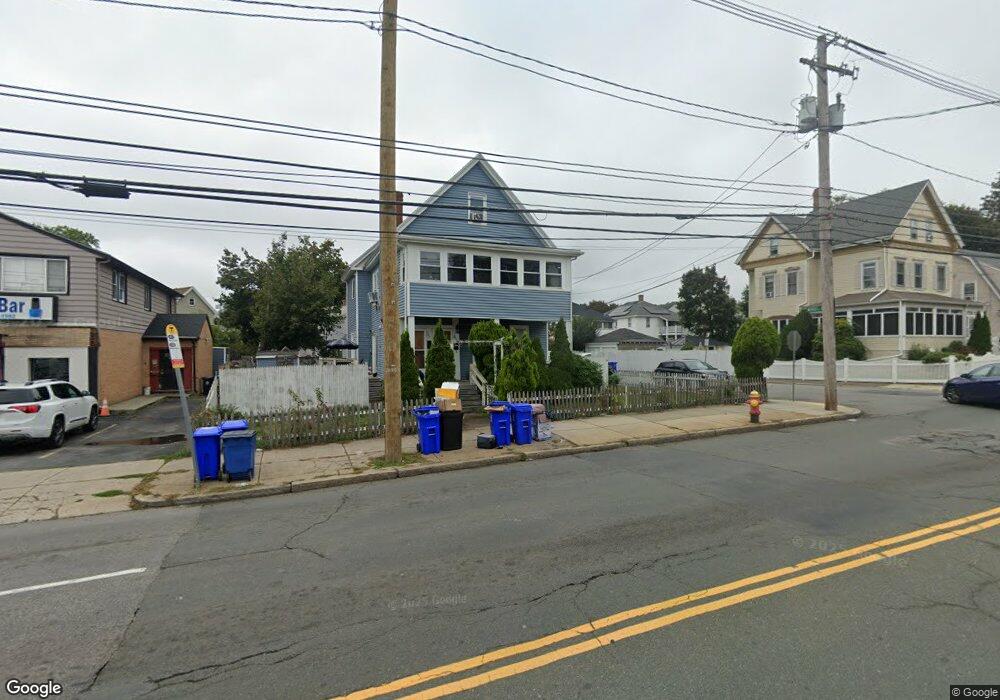
342 Broadway Unit 344 Malden, MA 02148
Maplewood NeighborhoodEstimated Value: $833,329 - $1,110,000
5
Beds
3
Baths
1,971
Sq Ft
$476/Sq Ft
Est. Value
About This Home
This home is located at 342 Broadway Unit 344, Malden, MA 02148 and is currently estimated at $937,582, approximately $475 per square foot. 342 Broadway Unit 344 is a home located in Middlesex County with nearby schools including Malden High School and Malden Catholic.
Ownership History
Date
Name
Owned For
Owner Type
Purchase Details
Closed on
Jun 1, 2006
Sold by
Nguyen Hongphuc H and Nguyen Uy A
Bought by
Fabo Alain and Kweudjeu-Fabo Anastasie
Current Estimated Value
Home Financials for this Owner
Home Financials are based on the most recent Mortgage that was taken out on this home.
Original Mortgage
$433,403
Interest Rate
6.55%
Mortgage Type
Purchase Money Mortgage
Purchase Details
Closed on
Feb 26, 1999
Sold by
Depippo Michael and Depippo Judith
Bought by
Nguyen Uy Anh
Home Financials for this Owner
Home Financials are based on the most recent Mortgage that was taken out on this home.
Original Mortgage
$214,650
Interest Rate
6.78%
Mortgage Type
Purchase Money Mortgage
Create a Home Valuation Report for This Property
The Home Valuation Report is an in-depth analysis detailing your home's value as well as a comparison with similar homes in the area
Home Values in the Area
Average Home Value in this Area
Purchase History
| Date | Buyer | Sale Price | Title Company |
|---|---|---|---|
| Fabo Alain | $440,000 | -- | |
| Nguyen Uy Anh | $220,000 | -- |
Source: Public Records
Mortgage History
| Date | Status | Borrower | Loan Amount |
|---|---|---|---|
| Open | Nguyen Uy Anh | $425,871 | |
| Closed | Nguyen Uy Anh | $427,315 | |
| Closed | Fabo Alain | $433,403 | |
| Previous Owner | Nguyen Uy Anh | $213,700 | |
| Previous Owner | Nguyen Uy Anh | $214,650 |
Source: Public Records
Tax History Compared to Growth
Tax History
| Year | Tax Paid | Tax Assessment Tax Assessment Total Assessment is a certain percentage of the fair market value that is determined by local assessors to be the total taxable value of land and additions on the property. | Land | Improvement |
|---|---|---|---|---|
| 2025 | $81 | $717,700 | $240,800 | $476,900 |
| 2024 | $7,922 | $677,700 | $232,200 | $445,500 |
| 2023 | $7,577 | $621,600 | $206,400 | $415,200 |
| 2022 | $7,253 | $587,300 | $184,900 | $402,400 |
| 2021 | $7,218 | $587,300 | $184,900 | $402,400 |
| 2020 | $6,827 | $539,700 | $164,700 | $375,000 |
| 2019 | $6,490 | $489,100 | $157,000 | $332,100 |
| 2018 | $6,642 | $471,400 | $157,000 | $314,400 |
| 2017 | $6,479 | $457,200 | $157,000 | $300,200 |
| 2016 | $6,143 | $405,200 | $144,100 | $261,100 |
| 2015 | $5,903 | $375,300 | $137,200 | $238,100 |
| 2014 | $5,495 | $341,300 | $124,700 | $216,600 |
Source: Public Records
Map
Nearby Homes
- 363 Broadway
- 14 Dodge St
- 48 Summit St
- 98 Summit St
- 1135 Salem St
- 26 Webber St Unit 1
- 19 Bellvale St
- 7 Sawyer Ct
- 115 Webster St
- 10 Birch Ln
- 0 Beachview Ave
- 82 Elwell St
- 36 Central Ave
- 44 Loomis St Unit 209
- 15 Mount Washington Ave
- 4 Anderson Way Unit 2
- 33 Lodgen Ct Unit 4G
- 59 Dexter Rd
- 188-190 Sylvan St
- 31 Preston St
- 326 Broadway Unit 11
- 340 Broadway Unit 2
- 338 Broadway
- 352 Broadway
- 354 Broadway
- 17 Mingo St
- 904 Salem St
- 17 Home St Unit 19
- 21 Home St
- 359 Broadway Unit 361
- 960 Salem St Unit 3
- 960 Salem St
- 27 Home St
- 357 Broadway Unit 357A
- 357-357A Broadway
- 357 Broadway Unit 1
- 888 Salem St Unit 894
- 362 Broadway
- 9 Durso Ave Unit 2
- 9 Durso Ave Unit 11