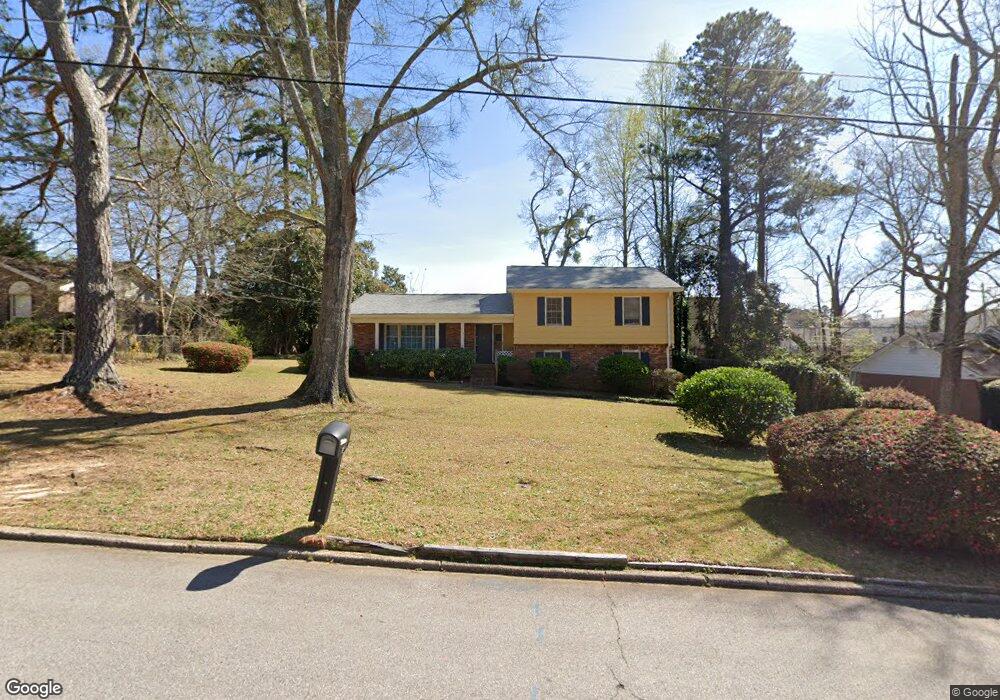
342 Brookridge Dr Lagrange, GA 30241
Estimated Value: $219,833 - $243,000
3
Beds
3
Baths
1,592
Sq Ft
$146/Sq Ft
Est. Value
About This Home
This home is located at 342 Brookridge Dr, Lagrange, GA 30241 and is currently estimated at $231,708, approximately $145 per square foot. 342 Brookridge Dr is a home located in Troup County with nearby schools including Franklin Forest Elementary School, Hollis Hand Elementary School, and Ethel W. Kight Elementary School.
Ownership History
Date
Name
Owned For
Owner Type
Purchase Details
Closed on
Jan 31, 2005
Sold by
Olajubutu Samuel O
Bought by
Dudley Cecil H and Dudley Nancy E
Current Estimated Value
Home Financials for this Owner
Home Financials are based on the most recent Mortgage that was taken out on this home.
Original Mortgage
$94,150
Interest Rate
5.72%
Mortgage Type
New Conventional
Purchase Details
Closed on
Jan 19, 1994
Sold by
Cook Nelda Noles
Bought by
Olajubutu Samuel O and Olajubutu Alice
Purchase Details
Closed on
Sep 2, 1971
Sold by
Sherrell James and Sherrell Loftin
Bought by
Cook Nelda Noles
Purchase Details
Closed on
Sep 1, 1968
Sold by
Roy M Waller
Bought by
Sherrell James and Sherrell Loftin
Create a Home Valuation Report for This Property
The Home Valuation Report is an in-depth analysis detailing your home's value as well as a comparison with similar homes in the area
Purchase History
| Date | Buyer | Sale Price | Title Company |
|---|---|---|---|
| Dudley Cecil H | $114,150 | -- | |
| Olajubutu Samuel O | $72,500 | -- | |
| Cook Nelda Noles | $32,000 | -- | |
| Sherrell James | -- | -- |
Source: Public Records
Mortgage History
| Date | Status | Borrower | Loan Amount |
|---|---|---|---|
| Closed | Dudley Cecil H | $94,150 |
Source: Public Records
Tax History
| Year | Tax Paid | Tax Assessment Tax Assessment Total Assessment is a certain percentage of the fair market value that is determined by local assessors to be the total taxable value of land and additions on the property. | Land | Improvement |
|---|---|---|---|---|
| 2025 | $2,114 | $82,848 | $10,000 | $72,848 |
| 2024 | $1,947 | $73,392 | $10,000 | $63,392 |
| 2023 | $1,689 | $63,924 | $10,000 | $53,924 |
| 2022 | $1,663 | $61,564 | $10,000 | $51,564 |
| 2021 | $1,299 | $45,072 | $8,000 | $37,072 |
| 2020 | $1,299 | $45,072 | $8,000 | $37,072 |
| 2019 | $1,257 | $43,672 | $8,000 | $35,672 |
| 2018 | $1,147 | $40,016 | $6,000 | $34,016 |
| 2017 | $1,147 | $40,016 | $6,000 | $34,016 |
| 2016 | $1,113 | $38,871 | $6,000 | $32,871 |
| 2015 | $1,083 | $37,810 | $6,000 | $31,810 |
| 2014 | $1,034 | $36,136 | $6,000 | $30,136 |
| 2013 | -- | $38,466 | $6,000 | $32,466 |
Source: Public Records
Map
Nearby Homes
- 706 N Harlem Cir
- 203 Bonaventure Dr
- 616 S Harlem Cir
- 224 Rutland Cir
- 102 Dogwood Dr
- 131 Foch St
- 202 Park Hill Dr
- 87 Youngs Mill Rd
- 210 Hearthstone Dr
- 121 de Groat St
- 204 Cleveland Dr
- 212 Cleveland Dr
- 115 Clara Jean Ct
- 110 Lenox Cir
- 301 E Bacon St
- 900 North St
- 806 New Franklin Rd
- 5 Curran Ave
- 110 Russell St
- 114 Briarcliff Rd
- 344 Brookridge Dr
- 340 Brookridge Dr
- 343 Brookridge Dr
- 346 Brookridge Dr
- 338 Brookridge Dr
- 341 Brookridge Dr
- 0 Brookridge Dr Unit 3058323
- 0 Brookridge Dr Unit 3058321
- 345 Brookridge Dr
- 348 Brookridge Dr
- 336 Brookridge Dr
- 349 Brookridge Dr
- 349 Brookridge Dr Unit LOT 12
- 347 Brookridge Dr
- 357 Brookridge Dr
- 469 Camelot Ct
- 334 Brookridge Dr
- 353 Hickory Terrace
- 471 Camelot Ct
- 361 Hickory Terrace
Your Personal Tour Guide
Ask me questions while you tour the home.