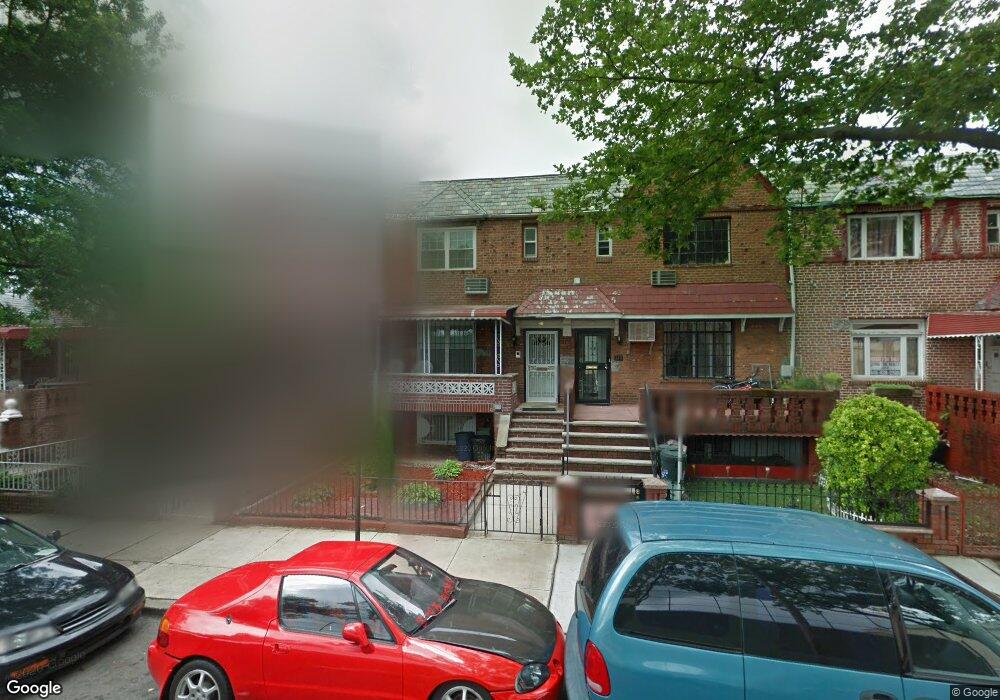
342 E 57th St Brooklyn, NY 11203
East Flatbush NeighborhoodEstimated Value: $632,140 - $757,000
Studio
--
Bath
1,400
Sq Ft
$509/Sq Ft
Est. Value
About This Home
This home is located at 342 E 57th St, Brooklyn, NY 11203 and is currently estimated at $712,285, approximately $508 per square foot. 342 E 57th St is a home located in Kings County with nearby schools including Ps 244 Richard R Green, I.S. 285 Meyer Levin, and Ivy Hill Preparatory Charter School.
Ownership History
Date
Name
Owned For
Owner Type
Purchase Details
Closed on
Oct 16, 2006
Sold by
Burns Merva Magdalene and Jones Everest W
Bought by
Dalton Blossom V
Current Estimated Value
Home Financials for this Owner
Home Financials are based on the most recent Mortgage that was taken out on this home.
Original Mortgage
$417,000
Outstanding Balance
$247,959
Interest Rate
6.49%
Mortgage Type
Purchase Money Mortgage
Estimated Equity
$464,326
Purchase Details
Closed on
Aug 18, 2005
Sold by
Burns Merva M and Jones Everest W
Bought by
Burns Merva M and Jones Everest W
Purchase Details
Closed on
Apr 30, 2003
Sold by
Ogundimu Michael O and Ojudon Adesola
Bought by
Burns Merva Nagdalene and Jones Everest W
Home Financials for this Owner
Home Financials are based on the most recent Mortgage that was taken out on this home.
Original Mortgage
$248,650
Interest Rate
6.02%
Mortgage Type
Purchase Money Mortgage
Create a Home Valuation Report for This Property
The Home Valuation Report is an in-depth analysis detailing your home's value as well as a comparison with similar homes in the area
Home Values in the Area
Average Home Value in this Area
Purchase History
| Date | Buyer | Sale Price | Title Company |
|---|---|---|---|
| Dalton Blossom V | $430,000 | -- | |
| Dalton Blossom | $430,000 | -- | |
| Burns Merva M | -- | -- | |
| Burns Merva M | -- | -- | |
| Burns Merva Nagdalene | $265,000 | -- | |
| Burns Merva Nagdalene | $265,000 | -- |
Source: Public Records
Mortgage History
| Date | Status | Borrower | Loan Amount |
|---|---|---|---|
| Open | Dalton Blossom | $417,000 | |
| Closed | Dalton Blossom V | $417,000 | |
| Previous Owner | Burns Merva Nagdalene | $248,650 |
Source: Public Records
Tax History
| Year | Tax Paid | Tax Assessment Tax Assessment Total Assessment is a certain percentage of the fair market value that is determined by local assessors to be the total taxable value of land and additions on the property. | Land | Improvement |
|---|---|---|---|---|
| 2025 | $6,076 | $43,860 | $13,980 | $29,880 |
| 2024 | $6,076 | $43,920 | $13,980 | $29,940 |
| 2023 | $5,780 | $45,180 | $13,980 | $31,200 |
| 2022 | $5,674 | $43,620 | $13,980 | $29,640 |
| 2021 | $5,654 | $35,460 | $13,980 | $21,480 |
| 2020 | $2,642 | $32,160 | $13,980 | $18,180 |
| 2019 | $5,224 | $32,160 | $13,980 | $18,180 |
| 2018 | $4,775 | $24,883 | $11,832 | $13,051 |
| 2017 | $4,773 | $24,883 | $12,180 | $12,703 |
| 2016 | $4,400 | $23,560 | $12,145 | $11,415 |
| 2015 | $2,611 | $22,227 | $13,805 | $8,422 |
| 2014 | $2,611 | $21,979 | $12,216 | $9,763 |
Source: Public Records
Map
Nearby Homes
Your Personal Tour Guide
Ask me questions while you tour the home.