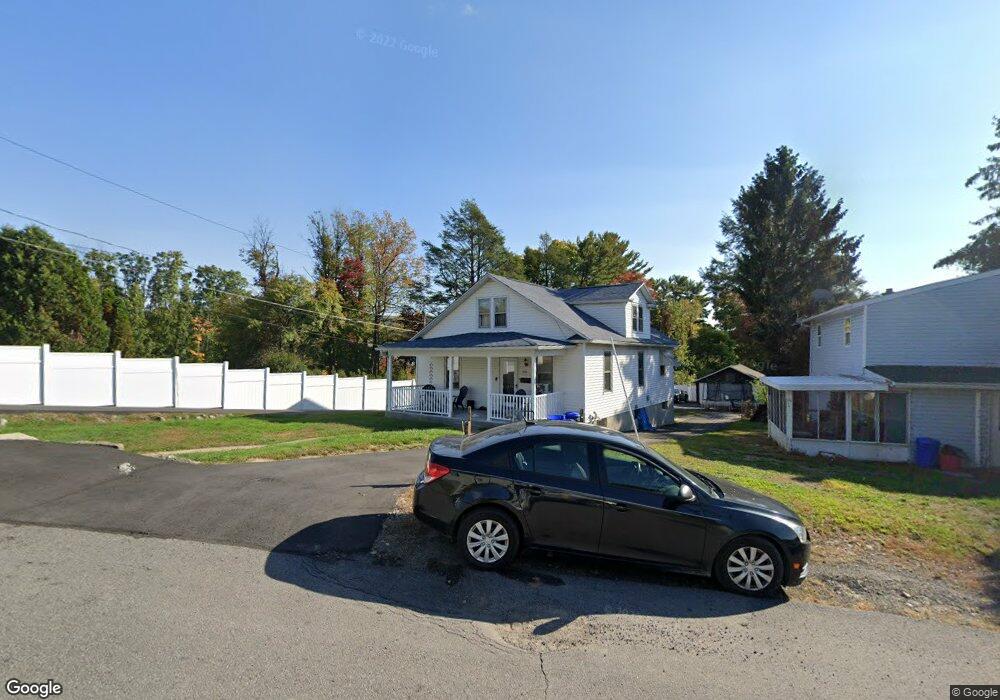
342 Lidy Rd Dupont, PA 18641
Estimated Value: $164,824 - $231,000
--
Bed
--
Bath
1,404
Sq Ft
$139/Sq Ft
Est. Value
About This Home
This home is located at 342 Lidy Rd, Dupont, PA 18641 and is currently estimated at $194,456, approximately $138 per square foot. 342 Lidy Rd is a home located in Luzerne County with nearby schools including Pittston City Intermediate Center, Pittston Area Middle School, and Frederick County Middle School.
Ownership History
Date
Name
Owned For
Owner Type
Purchase Details
Closed on
Jun 1, 2017
Sold by
Monahan John and Serino Catherine T
Bought by
Baritski Brandon John
Current Estimated Value
Home Financials for this Owner
Home Financials are based on the most recent Mortgage that was taken out on this home.
Original Mortgage
$48,000
Outstanding Balance
$39,937
Interest Rate
4.03%
Mortgage Type
New Conventional
Estimated Equity
$154,519
Purchase Details
Closed on
Jul 7, 2005
Sold by
Monahan Marilyn
Bought by
Monahan John and Serion Caterine T
Create a Home Valuation Report for This Property
The Home Valuation Report is an in-depth analysis detailing your home's value as well as a comparison with similar homes in the area
Home Values in the Area
Average Home Value in this Area
Purchase History
| Date | Buyer | Sale Price | Title Company |
|---|---|---|---|
| Baritski Brandon John | $60,000 | None Available | |
| Monahan John | -- | None Available |
Source: Public Records
Mortgage History
| Date | Status | Borrower | Loan Amount |
|---|---|---|---|
| Open | Baritski Brandon John | $48,000 |
Source: Public Records
Tax History Compared to Growth
Tax History
| Year | Tax Paid | Tax Assessment Tax Assessment Total Assessment is a certain percentage of the fair market value that is determined by local assessors to be the total taxable value of land and additions on the property. | Land | Improvement |
|---|---|---|---|---|
| 2025 | $1,938 | $78,700 | $36,700 | $42,000 |
| 2024 | $1,938 | $78,700 | $36,700 | $42,000 |
| 2023 | $1,938 | $78,700 | $36,700 | $42,000 |
| 2022 | $1,923 | $78,700 | $36,700 | $42,000 |
| 2021 | $1,923 | $78,700 | $36,700 | $42,000 |
| 2020 | $1,879 | $78,700 | $36,700 | $42,000 |
| 2019 | $1,864 | $78,700 | $36,700 | $42,000 |
| 2018 | $1,825 | $78,700 | $36,700 | $42,000 |
| 2017 | $1,745 | $78,700 | $36,700 | $42,000 |
| 2016 | -- | $78,700 | $36,700 | $42,000 |
| 2015 | $1,382 | $78,700 | $36,700 | $42,000 |
| 2014 | $1,382 | $78,700 | $36,700 | $42,000 |
Source: Public Records
Map
Nearby Homes