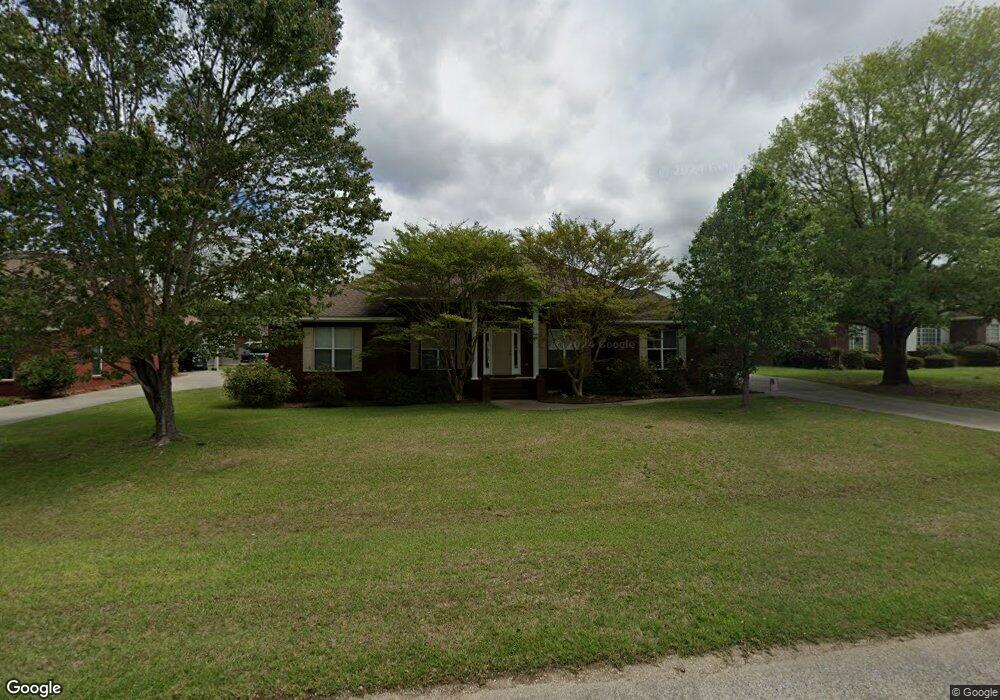
342 Magnolia Loop Millbrook, AL 36054
Estimated Value: $275,723 - $334,000
--
Bed
1
Bath
2,307
Sq Ft
$135/Sq Ft
Est. Value
About This Home
This home is located at 342 Magnolia Loop, Millbrook, AL 36054 and is currently estimated at $311,181, approximately $134 per square foot. 342 Magnolia Loop is a home located in Elmore County with nearby schools including Coosada Elementary School, Airport Road Intermediate School, and Millbrook Middle Junior High School.
Ownership History
Date
Name
Owned For
Owner Type
Purchase Details
Closed on
May 4, 2020
Sold by
Magnolia Ridge Llc
Bought by
Jones Gregory N and Jones Angel B
Current Estimated Value
Create a Home Valuation Report for This Property
The Home Valuation Report is an in-depth analysis detailing your home's value as well as a comparison with similar homes in the area
Home Values in the Area
Average Home Value in this Area
Purchase History
| Date | Buyer | Sale Price | Title Company |
|---|---|---|---|
| Jones Gregory N | $30,000 | None Available |
Source: Public Records
Tax History Compared to Growth
Tax History
| Year | Tax Paid | Tax Assessment Tax Assessment Total Assessment is a certain percentage of the fair market value that is determined by local assessors to be the total taxable value of land and additions on the property. | Land | Improvement |
|---|---|---|---|---|
| 2024 | $786 | $26,240 | $0 | $0 |
| 2023 | $794 | $267,800 | $35,000 | $232,800 |
| 2022 | $655 | $23,251 | $3,500 | $19,751 |
| 2021 | $620 | $22,101 | $3,500 | $18,601 |
| 2020 | $622 | $22,181 | $3,500 | $18,681 |
| 2019 | $602 | $23,001 | $5,000 | $18,001 |
| 2018 | $600 | $21,419 | $5,000 | $16,419 |
| 2017 | $600 | $21,420 | $5,000 | $16,420 |
| 2016 | $639 | $21,069 | $3,750 | $17,319 |
| 2014 | $672 | $221,580 | $50,000 | $171,580 |
Source: Public Records
Map
Nearby Homes
- 163 Magnolia Loop
- 4521 Bibb Dr
- 70 Cumberland Park Dr
- 3750 Henderson Place
- 4056 Rose Hill Rd
- 137 Mossey Ln
- 4330 Coosada Rd
- 137 Bishop Dr
- 4141 Linda Ann Dr
- 4211 Willowbrook Dr
- 3211 Rose Hill Rd
- 3963 Highway 14 Hwy
- 256 James Dr
- 406 James Ct
- 3547 Goree Dr
- 43 Kohn Dr
- 3881 Frasier St
- 5000 Woodfield Dr
- 4111 Oliver Dr
- 94 Matt Jordan Dr
- 360 Magnolia Loop
- 322 Magnolia Loop
- 180 Magnolia Loop
- 200 Magnolia Loop
- 160 Magnolia Loop
- 380 Magnolia Loop
- 339 Magnolia Loop
- 357 Magnolia Loop
- 319 Magnolia Loop
- 142 Magnolia Loop
- 273 Magnolia Loop
- 398 Magnolia Loop
- 255 Magnolia Loop
- 291 Magnolia Ridge
- 291 Magnolia Loop
- 122 Magnolia Loop
- 305 Magnolia Loop
- 235 Magnolia Loop
- 377 Magnolia Loop
- 183 Magnolia Loop