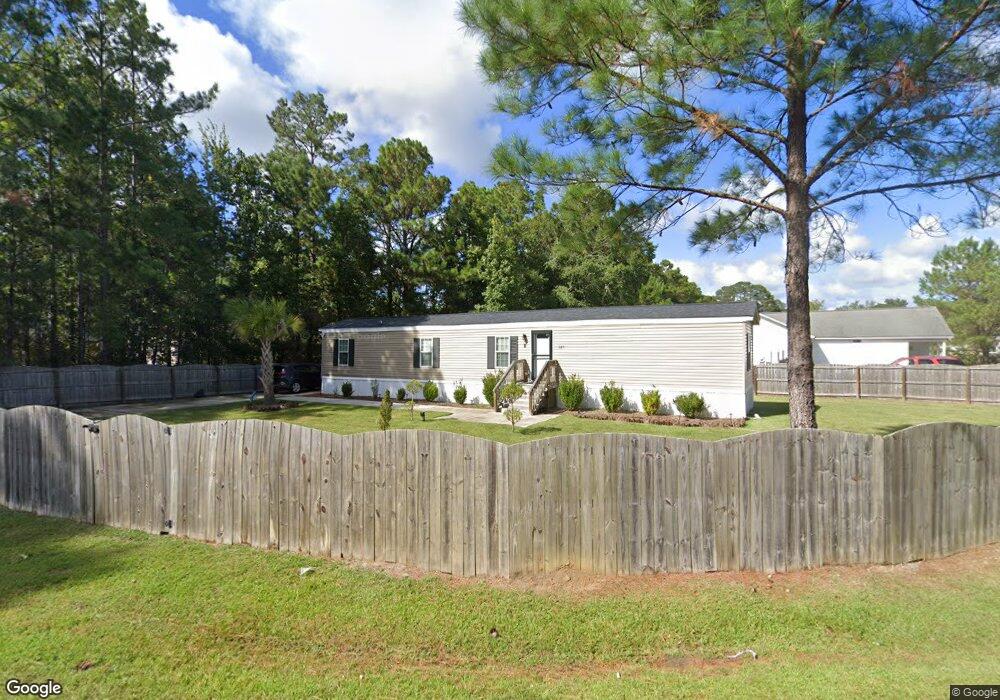
342 Player St Georgetown, SC 29440
Estimated Value: $188,000 - $228,000
3
Beds
2
Baths
1,436
Sq Ft
$149/Sq Ft
Est. Value
About This Home
This home is located at 342 Player St, Georgetown, SC 29440 and is currently estimated at $213,722, approximately $148 per square foot. 342 Player St is a home located in Georgetown County with nearby schools including McDonald Elementary School, Georgetown Middle School, and Georgetown High School.
Ownership History
Date
Name
Owned For
Owner Type
Purchase Details
Closed on
Apr 16, 2014
Sold by
Equity Trust Company
Bought by
Wilson Claudia I
Current Estimated Value
Purchase Details
Closed on
Jun 26, 2013
Sold by
Parson Brad
Bought by
Equity Turst Company and Donald F Salomone Ira
Purchase Details
Closed on
May 15, 2007
Sold by
F & S Holdings Inc
Bought by
Parsons Brad
Home Financials for this Owner
Home Financials are based on the most recent Mortgage that was taken out on this home.
Original Mortgage
$124,735
Interest Rate
6.12%
Mortgage Type
Purchase Money Mortgage
Purchase Details
Closed on
Nov 20, 2006
Sold by
Majors Frederick F
Bought by
F & S Holdings Inc and Fjs Construction
Home Financials for this Owner
Home Financials are based on the most recent Mortgage that was taken out on this home.
Original Mortgage
$92,000
Interest Rate
6.33%
Mortgage Type
Construction
Create a Home Valuation Report for This Property
The Home Valuation Report is an in-depth analysis detailing your home's value as well as a comparison with similar homes in the area
Purchase History
| Date | Buyer | Sale Price | Title Company |
|---|---|---|---|
| Wilson Claudia I | $100,000 | -- | |
| Equity Turst Company | $25,000 | -- | |
| Parsons Brad | $122,900 | None Available | |
| F & S Holdings Inc | -- | None Available |
Source: Public Records
Mortgage History
| Date | Status | Borrower | Loan Amount |
|---|---|---|---|
| Previous Owner | Parsons Brad | $124,735 | |
| Previous Owner | F & S Holdings Inc | $92,000 |
Source: Public Records
Tax History
| Year | Tax Paid | Tax Assessment Tax Assessment Total Assessment is a certain percentage of the fair market value that is determined by local assessors to be the total taxable value of land and additions on the property. | Land | Improvement |
|---|---|---|---|---|
| 2025 | $1,000 | $6,784 | $395 | $6,389 |
| 2024 | $1,000 | $5,900 | $430 | $5,470 |
| 2023 | $947 | $5,900 | $430 | $5,470 |
| 2022 | $879 | $5,900 | $430 | $5,470 |
| 2021 | $857 | $5,900 | $428 | $5,472 |
| 2020 | $855 | $5,900 | $428 | $5,472 |
| 2019 | $835 | $5,780 | $428 | $5,352 |
| 2018 | $853 | $57,800 | $0 | $0 |
| 2017 | $700 | $57,800 | $0 | $0 |
| 2016 | $691 | $5,780 | $0 | $0 |
| 2015 | $1,896 | $0 | $0 | $0 |
| 2014 | $1,896 | $138,900 | $10,700 | $128,200 |
| 2012 | -- | $138,900 | $10,700 | $128,200 |
Source: Public Records
Map
Nearby Homes
- 514 Antebellum Ln
- 345 Player St
- 44 Bennington Ct Unit Lot 4 - Custom
- 34 Bennington Ct Unit Lot 3 - Sewee 3-Car
- 24 Bennington Ct Unit Lot 2 - Cayman
- 14 Bennington Ct Unit Lot 1 - Key Largo 4
- 663 Player St
- 480 Lincolnshire Dr
- 1939 Mauricena Rd
- 85 Graham Ln
- 54 Juniper Place
- 3344 Highmarket St
- 210 County Road S-22-577
- 2905 Whites Bridge Dr
- 204 Ridge St
- 2527 Highmarket St
- 611 Dekalb St
- 621 Garden Ave
- 607 Garden Ave
- 380 Rose Ave
Your Personal Tour Guide
Ask me questions while you tour the home.