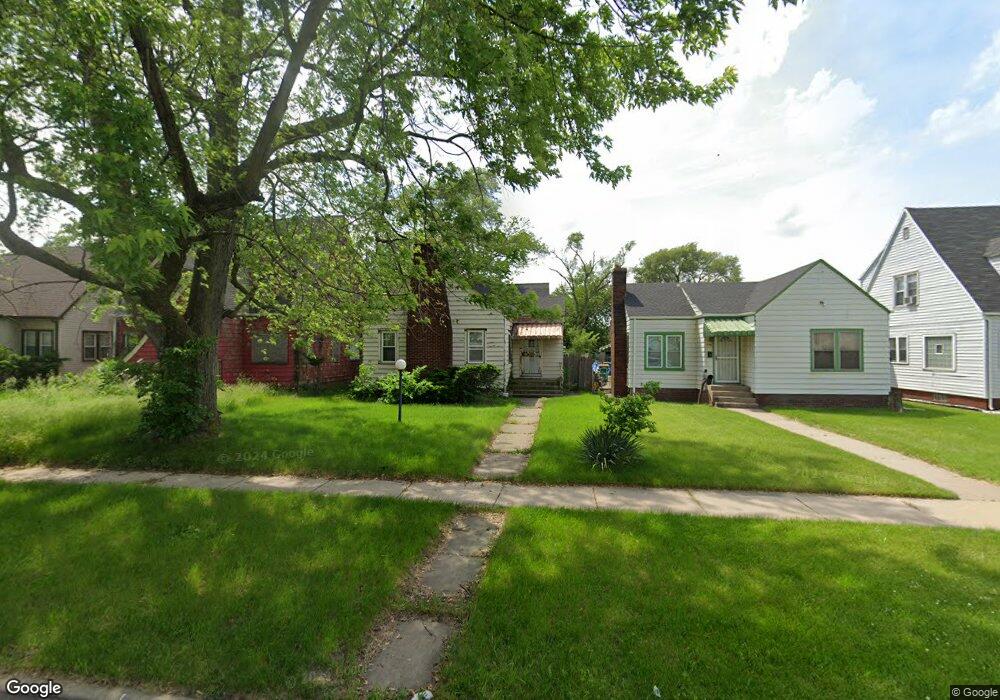
342 Taft St Gary, IN 46404
Ambridge-Mann NeighborhoodEstimated Value: $66,771 - $147,000
2
Beds
1
Bath
985
Sq Ft
$117/Sq Ft
Est. Value
About This Home
This home is located at 342 Taft St, Gary, IN 46404 and is currently estimated at $115,193, approximately $116 per square foot. 342 Taft St is a home located in Lake County with nearby schools including Beveridge Elementary School, Bailly Preparatory Academy, and West Side Leadership Academy.
Ownership History
Date
Name
Owned For
Owner Type
Purchase Details
Closed on
Jul 17, 2023
Sold by
Dickerson Candace
Bought by
Dickerson Devon
Current Estimated Value
Purchase Details
Closed on
Jul 5, 2022
Sold by
Eleanora Robinson
Bought by
Robinson Carneal B
Purchase Details
Closed on
Sep 13, 2019
Sold by
Robinson Ashley
Bought by
Robinson Eleanora
Purchase Details
Closed on
Mar 24, 2016
Sold by
Lake County Holdimgs Llc
Bought by
Robinson Ashley
Purchase Details
Closed on
Dec 4, 2015
Sold by
Gipson Lollie M
Bought by
Lake County Holdings
Create a Home Valuation Report for This Property
The Home Valuation Report is an in-depth analysis detailing your home's value as well as a comparison with similar homes in the area
Home Values in the Area
Average Home Value in this Area
Purchase History
| Date | Buyer | Sale Price | Title Company |
|---|---|---|---|
| Dickerson Devon | -- | None Listed On Document | |
| Robinson Carneal B | -- | None Listed On Document | |
| Robinson Carneal B | -- | None Listed On Document | |
| Robinson Eleanora | -- | None Available | |
| Robinson Ashley | -- | None Available | |
| Lake County Holdings | $2,000 | None Available |
Source: Public Records
Tax History
| Year | Tax Paid | Tax Assessment Tax Assessment Total Assessment is a certain percentage of the fair market value that is determined by local assessors to be the total taxable value of land and additions on the property. | Land | Improvement |
|---|---|---|---|---|
| 2025 | $731 | $56,300 | $7,100 | $49,200 |
| 2024 | $2,345 | $28,900 | $7,100 | $21,800 |
| 2023 | $671 | $26,600 | $6,700 | $19,900 |
| 2022 | $625 | $24,400 | $4,000 | $20,400 |
| 2021 | $582 | $22,700 | $4,000 | $18,700 |
| 2020 | $561 | $21,900 | $4,000 | $17,900 |
| 2019 | $641 | $23,800 | $4,400 | $19,400 |
| 2018 | $640 | $25,800 | $4,600 | $21,200 |
| 2017 | $622 | $26,000 | $4,600 | $21,400 |
| 2016 | $829 | $36,100 | $4,600 | $31,500 |
| 2014 | $316 | $34,600 | $5,400 | $29,200 |
| 2013 | $300 | $33,800 | $5,400 | $28,400 |
Source: Public Records
Map
Nearby Homes
- 357 Taft Place
- 418 Taft St
- 314 Cleveland St
- 2006 W 4th Place
- 541 Taft Place
- 200 Taft Place
- 419 Cleveland St
- 2100 W 2nd Ave
- 266 Johnson St
- 568 Johnson St
- 302 Lincoln St
- 327 Buchanan St
- 435 Buchanan St Unit 46402
- 2357 W 9th Ave
- 408 Pierce St
- 434 Pierce St
- 755 Johnson St
- 329 Pierce St
- 733 Lincoln St
- 600 Pierce St
Your Personal Tour Guide
Ask me questions while you tour the home.