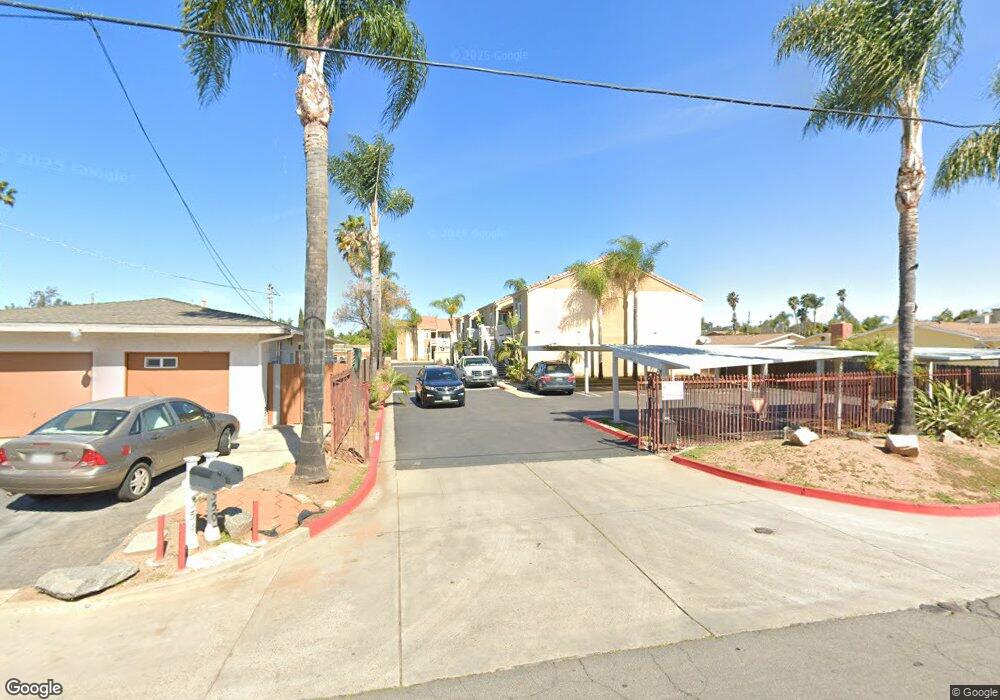
342 W 15th Ave Unit 13 Escondido, CA 92025
Central Escondido NeighborhoodEstimated Value: $452,706 - $596,000
2
Beds
2
Baths
948
Sq Ft
$533/Sq Ft
Est. Value
About This Home
This home is located at 342 W 15th Ave Unit 13, Escondido, CA 92025 and is currently estimated at $505,177, approximately $532 per square foot. 342 W 15th Ave Unit 13 is a home located in San Diego County with nearby schools including Juniper Elementary School, Bear Valley Middle School, and San Pasqual High School.
Ownership History
Date
Name
Owned For
Owner Type
Purchase Details
Closed on
Jan 31, 2023
Sold by
Shi Family Trust and Shi Zhi Qing
Bought by
Shi Family Trust and Shi
Current Estimated Value
Purchase Details
Closed on
Jun 19, 2009
Sold by
Federal Home Loan Mortgage Corporation
Bought by
Shi Zhi Oing and Xu Ai Ping
Purchase Details
Closed on
Oct 24, 2008
Sold by
Roberts Maria G
Bought by
Federal Home Loan Mortgage Corporation
Purchase Details
Closed on
May 16, 2008
Sold by
Ivy Michael J
Bought by
Roberts Maria G
Purchase Details
Closed on
Jan 18, 2008
Sold by
Roberts James
Bought by
Roberts Maria G
Home Financials for this Owner
Home Financials are based on the most recent Mortgage that was taken out on this home.
Original Mortgage
$342,000
Interest Rate
5.96%
Mortgage Type
Stand Alone Refi Refinance Of Original Loan
Purchase Details
Closed on
Oct 15, 2007
Sold by
Meadors/Renfeldt Development Lp
Bought by
Ivy Michael J
Create a Home Valuation Report for This Property
The Home Valuation Report is an in-depth analysis detailing your home's value as well as a comparison with similar homes in the area
Home Values in the Area
Average Home Value in this Area
Purchase History
| Date | Buyer | Sale Price | Title Company |
|---|---|---|---|
| Shi Family Trust | -- | None Listed On Document | |
| Shi Zhi Oing | $113,000 | Lsi Title | |
| Federal Home Loan Mortgage Corporation | $165,000 | First American Title Company | |
| Roberts Maria G | -- | Commonwealth Title | |
| Roberts Maria G | -- | Commonwealth Land Title Co | |
| Ivy Michael J | $360,000 | Commonwealth Land Title Co |
Source: Public Records
Mortgage History
| Date | Status | Borrower | Loan Amount |
|---|---|---|---|
| Previous Owner | Roberts Maria G | $342,000 |
Source: Public Records
Tax History Compared to Growth
Tax History
| Year | Tax Paid | Tax Assessment Tax Assessment Total Assessment is a certain percentage of the fair market value that is determined by local assessors to be the total taxable value of land and additions on the property. | Land | Improvement |
|---|---|---|---|---|
| 2025 | $1,660 | $145,851 | $32,265 | $113,586 |
| 2024 | $1,660 | $142,992 | $31,633 | $111,359 |
| 2023 | $1,623 | $140,189 | $31,013 | $109,176 |
| 2022 | $1,605 | $137,441 | $30,405 | $107,036 |
| 2021 | $1,580 | $134,747 | $29,809 | $104,938 |
| 2020 | $1,571 | $133,366 | $29,504 | $103,862 |
| 2019 | $1,533 | $130,752 | $28,926 | $101,826 |
| 2018 | $1,491 | $128,189 | $28,359 | $99,830 |
| 2017 | $1,467 | $125,676 | $27,803 | $97,873 |
| 2016 | $1,439 | $123,212 | $27,258 | $95,954 |
| 2015 | $1,427 | $121,362 | $26,849 | $94,513 |
| 2014 | $1,369 | $118,986 | $26,324 | $92,662 |
Source: Public Records
Map
Nearby Homes
- 340 W 15th Ave Unit 5
- 1550 S Maple St Unit 8
- 26 Bahama Dr
- 118 W 11th Ave
- 123 E 11th Ave
- 1651 S Juniper St Unit 32
- 1651 S Juniper St Unit 110
- 1651 S Juniper St Unit 217
- 1651 S Juniper St Unit 10
- 1651 S Juniper St Unit 195
- 514 W 10th Ave
- 1860 S Escondido Blvd
- 320 W 8th Ave
- 759 W 10th Ave
- 450 W Vermont Ave Unit 1602
- 450 W Vermont Ave Unit 805
- 118 W 8th Ave
- 1800 S Juniper St
- 752 W 9th Ave
- 125 W Vermont Ave Unit B
- 342 W 15th Ave
- 340 W 15th Ave
- 340 W 15th Ave Unit 18
- 342 W 15th Ave Unit 20
- 342 W 15th Ave Unit 19
- 342 W 15th Ave Unit 18
- 342 W 15th Ave Unit 17
- 342 W 15th Ave Unit 16
- 342 W 15th Ave Unit 15
- 342 W 15th Ave Unit 14
- 342 W 15th Ave Unit 12
- 342 W 15th Ave Unit 11
- 340 W 15th Ave Unit 10
- 340 W 15th Ave Unit 9
- 340 W 15th Ave Unit 8
- 340 W 15th Ave Unit 7
- 340 W 15th Ave Unit 6
- 340 W 15th Ave Unit 4
- 340 W 15th Ave Unit 3
- 340 W 15th Ave Unit 2