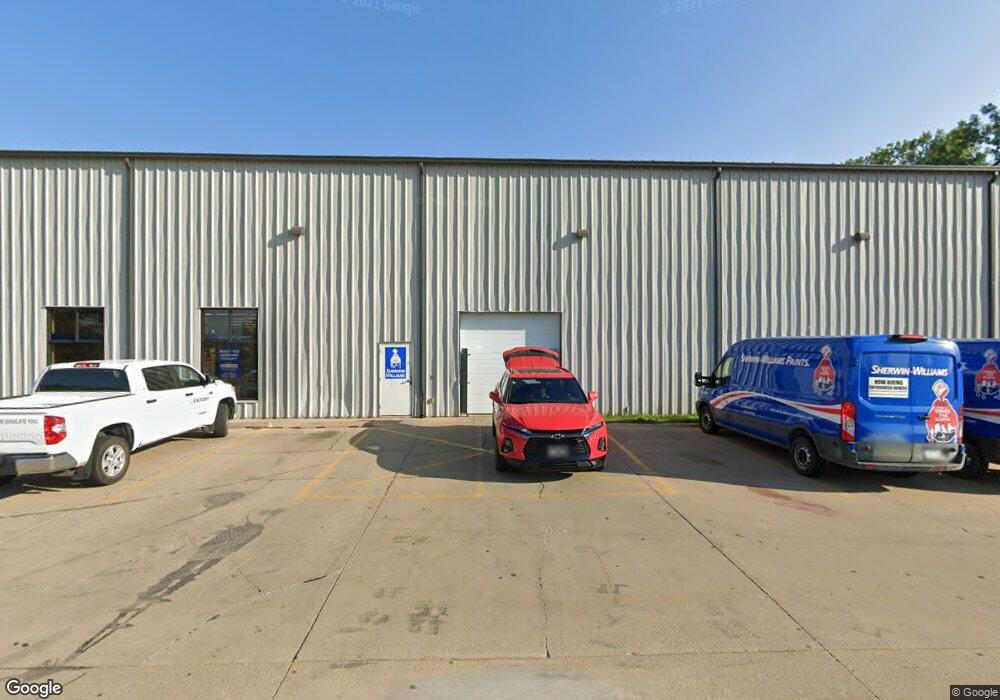
3421 J St SW Cedar Rapids, IA 52404
Southwest Area NeighborhoodEstimated Value: $1,799,578
--
Bed
--
Bath
6,651
Sq Ft
$271/Sq Ft
Est. Value
About This Home
This home is located at 3421 J St SW, Cedar Rapids, IA 52404 and is currently estimated at $1,799,578, approximately $270 per square foot. 3421 J St SW is a home located in Linn County with nearby schools including Junction City Elementary School, Grant Elementary School, and Bruce Hall Day Treatment Center.
Ownership History
Date
Name
Owned For
Owner Type
Purchase Details
Closed on
Sep 13, 2015
Sold by
Pedersen Jeffrey G and Pedersen Michelle J
Bought by
Realty Income Properties 6 Llc
Current Estimated Value
Purchase Details
Closed on
Sep 29, 2011
Sold by
Gillenwater Melvin C and Gillenwater Mary Anne
Bought by
Pedersen Jeffrey G and Pedersen Michelle J
Home Financials for this Owner
Home Financials are based on the most recent Mortgage that was taken out on this home.
Original Mortgage
$950,000
Interest Rate
4.23%
Mortgage Type
Future Advance Clause Open End Mortgage
Purchase Details
Closed on
Jun 1, 2009
Sold by
Jebob Llc
Bought by
Gillenwater Melvin Charles and Melvin Charles Gillenwater Revocable Liv
Home Financials for this Owner
Home Financials are based on the most recent Mortgage that was taken out on this home.
Original Mortgage
$680,000
Interest Rate
4.85%
Mortgage Type
Construction
Create a Home Valuation Report for This Property
The Home Valuation Report is an in-depth analysis detailing your home's value as well as a comparison with similar homes in the area
Home Values in the Area
Average Home Value in this Area
Purchase History
| Date | Buyer | Sale Price | Title Company |
|---|---|---|---|
| Realty Income Properties 6 Llc | $1,129,000 | Fidelity Natl Title Ncs Div | |
| Pedersen Jeffrey G | $949,500 | None Available | |
| Gillenwater Melvin Charles | $479,500 | None Available |
Source: Public Records
Mortgage History
| Date | Status | Borrower | Loan Amount |
|---|---|---|---|
| Previous Owner | Pedersen Jeffrey G | $950,000 | |
| Previous Owner | Gillenwater Melvin Charles | $680,000 |
Source: Public Records
Tax History Compared to Growth
Tax History
| Year | Tax Paid | Tax Assessment Tax Assessment Total Assessment is a certain percentage of the fair market value that is determined by local assessors to be the total taxable value of land and additions on the property. | Land | Improvement |
|---|---|---|---|---|
| 2025 | $21,478 | $750,300 | $107,700 | $642,600 |
| 2024 | $17,450 | $697,700 | $107,700 | $590,000 |
| 2023 | $17,450 | $697,700 | $107,700 | $590,000 |
| 2022 | $18,458 | $561,300 | $107,700 | $453,600 |
| 2021 | $19,228 | $972,200 | $99,600 | $872,600 |
| 2020 | $19,228 | $992,800 | $99,600 | $893,200 |
| 2019 | $18,616 | $546,200 | $99,600 | $446,600 |
| 2018 | $18,524 | $546,200 | $99,600 | $446,600 |
| 2017 | $15,996 | $465,100 | $99,600 | $365,500 |
| 2016 | $15,996 | $465,100 | $99,600 | $365,500 |
| 2015 | $16,406 | $477,468 | $99,540 | $377,928 |
| 2014 | $14,000 | $477,468 | $99,540 | $377,928 |
| 2013 | $16,438 | $477,468 | $99,540 | $377,928 |
Source: Public Records
Map
Nearby Homes
- 148 33rd Ave SW
- 90 29th Ave SW
- 3212 Southland St SW
- 9 33rd Ave SW
- 2937 Southland St SW
- 2818 Southland St SW
- 3010 Bowling St SW
- 42 Park Village Ave SW
- 2955 Bowling St SW Unit E238
- 51 29th Avenue Dr SW Unit D11
- 51 29th Avenue Dr SW Unit C22
- 109 Evelyn Dr SW
- 2536 L St SW
- 7000 Harlan Eddy Dr SW
- 2601 Teresa Dr SW
- 2511 Indiana St SW
- 2417 Illinois St SW
- 2401 Victoria Dr SW
- 186 22nd Ave SW
- 2021 Hamilton St SW
- 3509 J St SW
- 3415 J St SW
- 3321 J St SW
- 3321 J St SW Unit 3 & 4
- 3321 J St SW Unit 106
- 3321 J St SW Unit 100
- 3321 J St SW Unit 104
- 3321 J St SW Unit 102
- 141 33rd Ave SW Unit 14136
- 141 33rd Ave SW Unit 14135
- 141 33rd Ave SW Unit 14134
- 141 33rd Ave SW Unit 14133
- 141 33rd Ave SW Unit 14132
- 141 33rd Ave SW Unit 14131
- 141 33rd Ave SW Unit 14130
- 141 33rd Ave SW Unit 14129
- 141 33rd Ave SW Unit 14128
- 141 33rd Ave SW Unit 14127
- 141 33rd Ave SW Unit 14126
- 141 33rd Ave SW Unit 14125