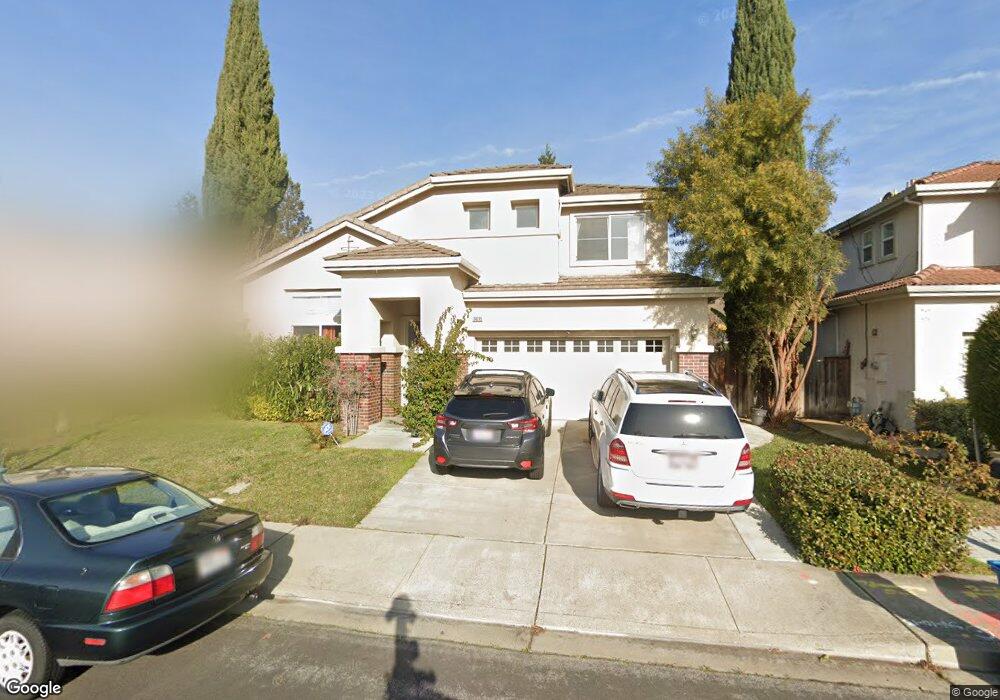
34215 Red Cedar Ct Union City, CA 94587
Downtown Union City NeighborhoodEstimated Value: $1,578,419 - $1,808,000
4
Beds
3
Baths
2,205
Sq Ft
$776/Sq Ft
Est. Value
About This Home
This home is located at 34215 Red Cedar Ct, Union City, CA 94587 and is currently estimated at $1,711,605, approximately $776 per square foot. 34215 Red Cedar Ct is a home located in Alameda County with nearby schools including Guy Jr. Emanuele Elementary School, Cesar Chavez Middle School, and James Logan High School.
Ownership History
Date
Name
Owned For
Owner Type
Purchase Details
Closed on
Apr 21, 2010
Sold by
Lin Karin S and Murray Geoffrey C
Bought by
Kahlon Kirpal S and Kahlon Kulwinder K
Current Estimated Value
Home Financials for this Owner
Home Financials are based on the most recent Mortgage that was taken out on this home.
Original Mortgage
$510,000
Outstanding Balance
$335,443
Interest Rate
4.75%
Mortgage Type
New Conventional
Estimated Equity
$1,376,162
Purchase Details
Closed on
Feb 21, 2001
Sold by
Scs Development Co
Bought by
Murray Geoffrey C and Lin Karin S
Home Financials for this Owner
Home Financials are based on the most recent Mortgage that was taken out on this home.
Original Mortgage
$559,950
Interest Rate
7.12%
Create a Home Valuation Report for This Property
The Home Valuation Report is an in-depth analysis detailing your home's value as well as a comparison with similar homes in the area
Home Values in the Area
Average Home Value in this Area
Purchase History
| Date | Buyer | Sale Price | Title Company |
|---|---|---|---|
| Kahlon Kirpal S | $703,000 | Fidelity National Title Co | |
| Murray Geoffrey C | $700,000 | First American Title Guarant |
Source: Public Records
Mortgage History
| Date | Status | Borrower | Loan Amount |
|---|---|---|---|
| Open | Kahlon Kirpal S | $510,000 | |
| Previous Owner | Murray Geoffrey C | $559,950 | |
| Closed | Murray Geoffrey C | $69,950 |
Source: Public Records
Tax History Compared to Growth
Tax History
| Year | Tax Paid | Tax Assessment Tax Assessment Total Assessment is a certain percentage of the fair market value that is determined by local assessors to be the total taxable value of land and additions on the property. | Land | Improvement |
|---|---|---|---|---|
| 2025 | $13,061 | $900,382 | $272,214 | $635,168 |
| 2024 | $13,061 | $882,597 | $266,879 | $622,718 |
| 2023 | $12,675 | $872,155 | $261,646 | $610,509 |
| 2022 | $12,467 | $848,058 | $256,517 | $598,541 |
| 2021 | $12,191 | $831,298 | $251,489 | $586,809 |
| 2020 | $11,911 | $829,708 | $248,912 | $580,796 |
| 2019 | $12,019 | $813,440 | $244,032 | $569,408 |
| 2018 | $11,745 | $797,497 | $239,249 | $558,248 |
| 2017 | $11,468 | $781,861 | $234,558 | $547,303 |
| 2016 | $11,059 | $766,536 | $229,961 | $536,575 |
| 2015 | $10,853 | $755,028 | $226,508 | $528,520 |
| 2014 | $10,455 | $740,244 | $222,073 | $518,171 |
Source: Public Records
Map
Nearby Homes
- 34237 Torrey Pine Ln
- 126 Bellflower Ln
- 33718 3rd St
- 33848 10th St
- 33840 10th St
- 33852 11th St
- 33603 3rd St
- 33853 10th St
- 902 G St
- 33548 4th St
- 1020 Carnelian Terrace
- 35005 11th St
- 365 Monaco Ave
- 33846 14th St
- 33721 12th St
- 213 Ladera Plaza Unit 13
- 352 Monte Carlo Ave
- 208 Appian Way
- 217 Appian Way
- 33528 13th St
- 34219 Red Cedar Ct
- 34211 Red Cedar Ct
- 34207 Red Cedar Ct
- 110 Aspen Loop
- 34214 Red Cedar Ct
- 34218 Red Cedar Ct
- 34200 Red Cedar Ct
- 111 Aspen Loop
- 34223 Red Cedar Ln
- 108 Aspen Loop
- 108 Aspen Loop
- 34210 Red Cedar Ct
- 34206 Red Cedar Ct
- 34268 Myrtle Ln
- 208 Elias Dr
- 109 Aspen Loop
- 34222 Red Cedar Ln
- 34227 Red Cedar Ln
- 34217 Torrey Pine Ct
- 34269 Myrtle Ln