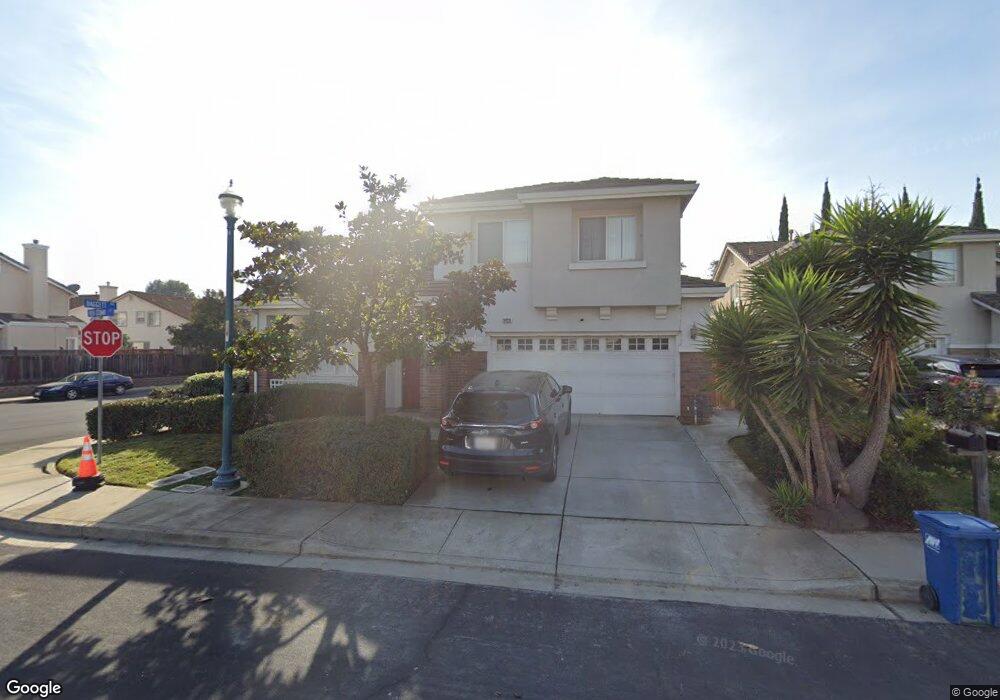
34218 Red Cedar Ct Union City, CA 94587
Downtown Union City NeighborhoodEstimated Value: $1,635,000 - $1,905,000
5
Beds
3
Baths
2,605
Sq Ft
$679/Sq Ft
Est. Value
About This Home
This home is located at 34218 Red Cedar Ct, Union City, CA 94587 and is currently estimated at $1,769,805, approximately $679 per square foot. 34218 Red Cedar Ct is a home located in Alameda County with nearby schools including Guy Jr. Emanuele Elementary School, Cesar Chavez Middle School, and James Logan High School.
Ownership History
Date
Name
Owned For
Owner Type
Purchase Details
Closed on
Nov 20, 2017
Sold by
Yonisi Idris
Bought by
More Ambarish and Sathe Meenal
Current Estimated Value
Home Financials for this Owner
Home Financials are based on the most recent Mortgage that was taken out on this home.
Original Mortgage
$636,000
Outstanding Balance
$533,780
Interest Rate
3.91%
Mortgage Type
New Conventional
Estimated Equity
$1,236,025
Purchase Details
Closed on
Jun 15, 2005
Sold by
Ko Lawrence K C and Ko Lilly L
Bought by
Yonisi Idris
Home Financials for this Owner
Home Financials are based on the most recent Mortgage that was taken out on this home.
Original Mortgage
$701,000
Interest Rate
1%
Mortgage Type
Negative Amortization
Purchase Details
Closed on
May 22, 2001
Sold by
Scs Development Co
Bought by
Ko Lawrence K C and Ko Lilly L
Home Financials for this Owner
Home Financials are based on the most recent Mortgage that was taken out on this home.
Original Mortgage
$553,100
Interest Rate
7.25%
Create a Home Valuation Report for This Property
The Home Valuation Report is an in-depth analysis detailing your home's value as well as a comparison with similar homes in the area
Home Values in the Area
Average Home Value in this Area
Purchase History
| Date | Buyer | Sale Price | Title Company |
|---|---|---|---|
| More Ambarish | $1,130,000 | Fidelity National Title Co | |
| Yonisi Idris | $935,000 | Fidelity National Title Co | |
| Ko Lawrence K C | $691,500 | First American Title Guarant |
Source: Public Records
Mortgage History
| Date | Status | Borrower | Loan Amount |
|---|---|---|---|
| Open | More Ambarish | $636,000 | |
| Previous Owner | Yonisi Idris | $701,000 | |
| Previous Owner | Ko Lawrence K C | $553,100 |
Source: Public Records
Tax History
| Year | Tax Paid | Tax Assessment Tax Assessment Total Assessment is a certain percentage of the fair market value that is determined by local assessors to be the total taxable value of land and additions on the property. | Land | Improvement |
|---|---|---|---|---|
| 2025 | $17,732 | $1,285,724 | $385,717 | $900,007 |
| 2024 | $17,732 | $1,260,514 | $378,154 | $882,360 |
| 2023 | $17,243 | $1,235,801 | $370,740 | $865,061 |
| 2022 | $16,982 | $1,211,574 | $363,472 | $848,102 |
| 2021 | $16,609 | $1,187,821 | $356,346 | $831,475 |
| 2020 | $16,223 | $1,175,651 | $352,695 | $822,956 |
| 2019 | $16,390 | $1,152,600 | $345,780 | $806,820 |
| 2018 | $16,022 | $1,130,000 | $339,000 | $791,000 |
| 2017 | $15,836 | $1,122,915 | $336,874 | $786,041 |
| 2016 | $12,984 | $915,000 | $274,500 | $640,500 |
| 2015 | $11,775 | $822,000 | $246,600 | $575,400 |
| 2014 | $11,032 | $780,000 | $234,000 | $546,000 |
Source: Public Records
Map
Nearby Homes
- 33941 9th St
- 33848 10th St
- 33840 10th St
- 33853 10th St
- 33638 9th St
- 645 F St
- 33554 7th St
- 110 Pear Ln
- 35185 11th St Unit 274
- 267 Famoso Plaza
- 235 Famoso Plaza
- 245 Famoso Plaza
- 33721 12th St
- 116 Mahogany Ln
- 152 Aurora Plaza
- 165 Aurora Plaza
- 1059 Sapphire Terrace Unit 353
- 33528 13th St
- 352 Monte Carlo Ave
- 351 Riviera Dr
- 34214 Red Cedar Ct
- 34217 Torrey Pine Ct
- 34213 Torrey Pine Ct
- 34222 Red Cedar Ln
- 34210 Red Cedar Ct
- 34219 Red Cedar Ct
- 34221 Torrey Pine Ln
- 34215 Red Cedar Ct
- 34226 Red Cedar Ln
- 34209 Torrey Pine Ct
- 34223 Red Cedar Ln
- 34206 Red Cedar Ct
- 34211 Red Cedar Ct
- 34225 Torrey Pine Ln
- 34200 Red Cedar Ct
- 34227 Red Cedar Ln
- 34230 Red Cedar Ln
- 34216 Torrey Pine Ct
- 34207 Red Cedar Ct
- 64218 Red Cedar Ct
Your Personal Tour Guide
Ask me questions while you tour the home.