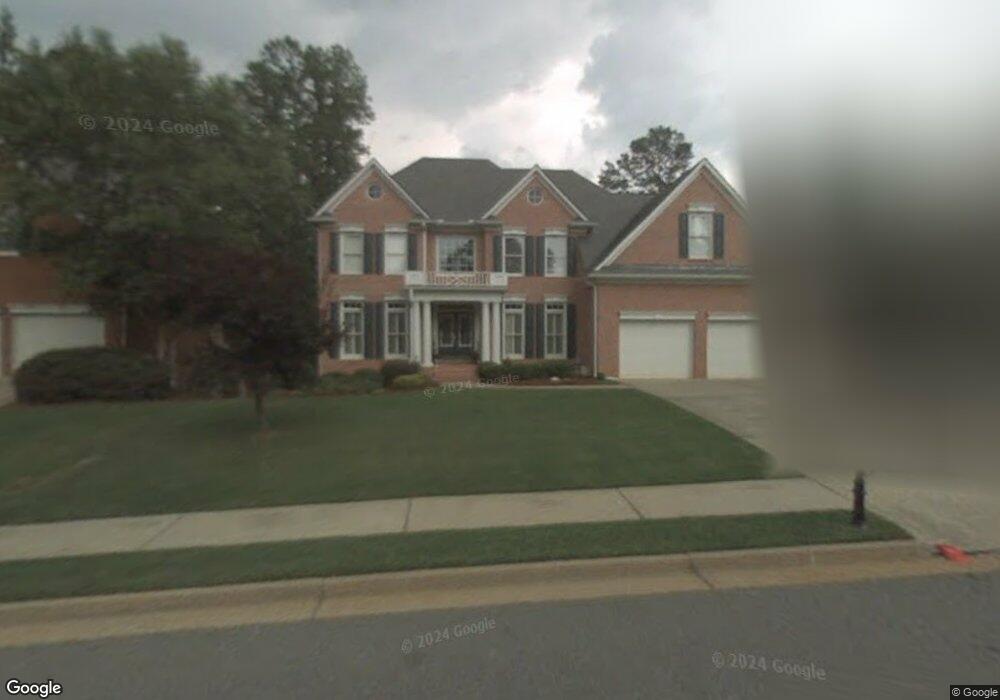
3422 Woodshire Crossing Unit B6 Marietta, GA 30066
Sandy Plains NeighborhoodEstimated Value: $1,004,003 - $1,061,000
4
Beds
5
Baths
3,362
Sq Ft
$304/Sq Ft
Est. Value
About This Home
This home is located at 3422 Woodshire Crossing Unit B6, Marietta, GA 30066 and is currently estimated at $1,022,501, approximately $304 per square foot. 3422 Woodshire Crossing Unit B6 is a home located in Cobb County with nearby schools including Mountain View Elementary School, Simpson Middle School, and Lassiter High School.
Ownership History
Date
Name
Owned For
Owner Type
Purchase Details
Closed on
May 23, 2001
Sold by
Parker James B and Parker Jill A
Bought by
Marcolina Michael and Marcolina Paula
Current Estimated Value
Home Financials for this Owner
Home Financials are based on the most recent Mortgage that was taken out on this home.
Original Mortgage
$325,000
Outstanding Balance
$115,509
Interest Rate
6.38%
Mortgage Type
New Conventional
Estimated Equity
$906,992
Purchase Details
Closed on
Sep 10, 1999
Sold by
John Wieland Homes & Neigh Inc
Bought by
Parker James B and Parker Jill A
Home Financials for this Owner
Home Financials are based on the most recent Mortgage that was taken out on this home.
Original Mortgage
$300,000
Interest Rate
7.91%
Mortgage Type
New Conventional
Create a Home Valuation Report for This Property
The Home Valuation Report is an in-depth analysis detailing your home's value as well as a comparison with similar homes in the area
Home Values in the Area
Average Home Value in this Area
Purchase History
| Date | Buyer | Sale Price | Title Company |
|---|---|---|---|
| Marcolina Michael | $452,000 | -- | |
| Parker James B | $375,000 | -- |
Source: Public Records
Mortgage History
| Date | Status | Borrower | Loan Amount |
|---|---|---|---|
| Open | Marcolina Michael | $325,000 | |
| Previous Owner | Parker James B | $300,000 |
Source: Public Records
Tax History Compared to Growth
Tax History
| Year | Tax Paid | Tax Assessment Tax Assessment Total Assessment is a certain percentage of the fair market value that is determined by local assessors to be the total taxable value of land and additions on the property. | Land | Improvement |
|---|---|---|---|---|
| 2025 | $11,033 | $375,196 | $80,000 | $295,196 |
| 2024 | $11,312 | $375,196 | $80,000 | $295,196 |
| 2023 | $10,621 | $352,264 | $70,000 | $282,264 |
| 2022 | $8,914 | $293,696 | $54,400 | $239,296 |
| 2021 | $8,914 | $293,696 | $54,400 | $239,296 |
| 2020 | $7,814 | $257,448 | $54,400 | $203,048 |
| 2019 | $7,812 | $257,392 | $54,400 | $202,992 |
| 2018 | $7,812 | $257,392 | $54,400 | $202,992 |
| 2017 | $6,772 | $235,552 | $50,000 | $185,552 |
| 2016 | $6,772 | $235,552 | $50,000 | $185,552 |
| 2015 | $6,388 | $216,840 | $60,000 | $156,840 |
| 2014 | $6,442 | $216,840 | $0 | $0 |
Source: Public Records
Map
Nearby Homes
- 3505 Bonaire Ct
- 2477 Bobbie Dr
- 3465 Staci Ct NE
- 3663 Heatherwood Dr NE
- 3901 Hazelhurst Dr
- 3851 Trickum Rd NE
- 2578 Middle Coray Cir
- 2696 S Arbor Dr
- 2415 Wistful Way
- 3798 Upland Dr
- 2403 Wistful Way
- 4050 Idlewilde Meadows Dr NE
- 3283 Holly Springs Rd NE
- 2591 Sandy Dr
- 3812 Havenrock Dr
- 3816 Havenrock Dr
- 4259 Arbor Club Dr
- 2124 Lassiter Field Dr NE
- 3424 Woodshire Crossing Unit 6
- 3420 Woodshire Crossing
- 3557 Woodshire Trail
- 3555 Woodshire Trail
- 3418 Woodshire Crossing
- 3559 Woodshire Trail
- 3620 Woodshire Chase
- 3423 Woodshire Crossing
- 3425 Woodshire Crossing
- 3622 Woodshire Chase
- 0 Woodshire Crossing Unit 7490355
- 0 Woodshire Crossing Unit 7299774
- 0 Woodshire Crossing Unit 8282169
- 0 Woodshire Crossing Unit 8106839
- 0 Woodshire Crossing Unit 8183422
- 0 Woodshire Crossing Unit 3082713
- 3553 Woodshire Trail Unit C4
- 3421 Woodshire Crossing
- 3416 Woodshire Crossing
- 3427 Woodshire Crossing