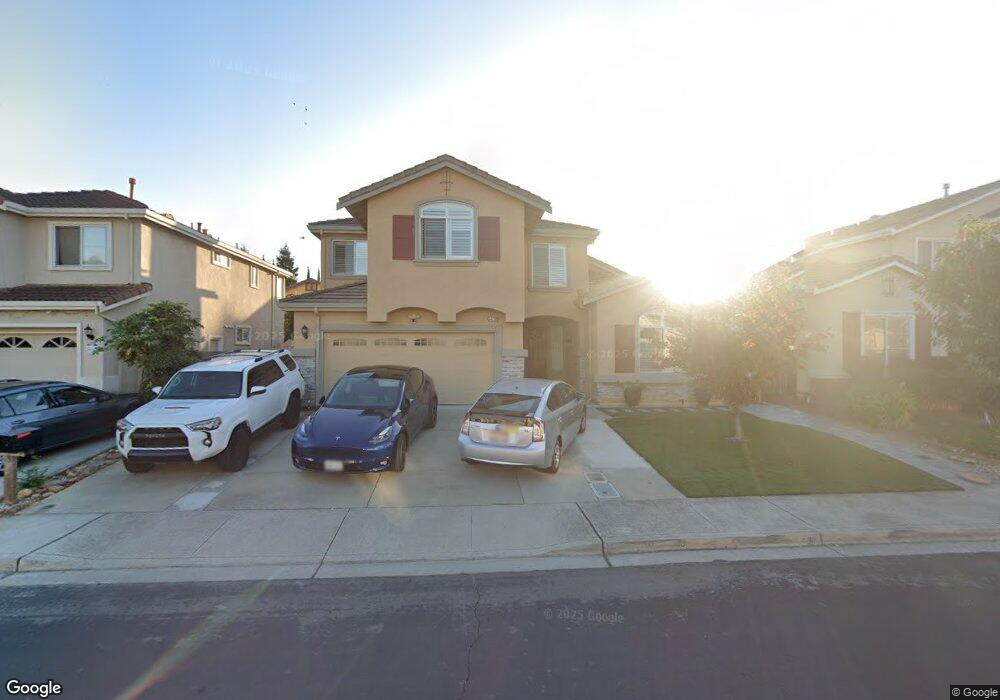
34232 Aspen Loop Union City, CA 94587
Downtown Union City NeighborhoodEstimated Value: $1,545,718 - $1,769,000
5
Beds
3
Baths
2,300
Sq Ft
$723/Sq Ft
Est. Value
About This Home
This home is located at 34232 Aspen Loop, Union City, CA 94587 and is currently estimated at $1,662,680, approximately $722 per square foot. 34232 Aspen Loop is a home located in Alameda County with nearby schools including Guy Jr. Emanuele Elementary School, Cesar Chavez Middle School, and James Logan High School.
Ownership History
Date
Name
Owned For
Owner Type
Purchase Details
Closed on
Nov 30, 2025
Sold by
Kaur Pushpinder and Kailley Family Revocable Trust
Bought by
Sangha Navdeep K and Sangha Kulmohan S
Current Estimated Value
Purchase Details
Closed on
Jun 11, 2016
Sold by
Kaur Jaspreet and Kailley Sukhdev Singh
Bought by
Kailley Sukhdev Singh and Kaur Pushpinder
Home Financials for this Owner
Home Financials are based on the most recent Mortgage that was taken out on this home.
Original Mortgage
$285,000
Interest Rate
3.58%
Mortgage Type
Purchase Money Mortgage
Purchase Details
Closed on
Apr 12, 2011
Sold by
Kailley Sukhdev Singh and Kaur Pushpinder
Bought by
Kailley Sukhdev Singh and Kaur Pushpinder
Purchase Details
Closed on
Sep 2, 2009
Sold by
Fleck Charles H and Fleck Judith L
Bought by
Kaur Jaspreet and Kaur Pushpinder
Home Financials for this Owner
Home Financials are based on the most recent Mortgage that was taken out on this home.
Original Mortgage
$450,000
Interest Rate
5.2%
Mortgage Type
New Conventional
Purchase Details
Closed on
Aug 4, 1999
Sold by
Scs Development Co
Bought by
Fleck Charles H and Fleck Judith L
Home Financials for this Owner
Home Financials are based on the most recent Mortgage that was taken out on this home.
Original Mortgage
$341,444
Interest Rate
7.25%
Create a Home Valuation Report for This Property
The Home Valuation Report is an in-depth analysis detailing your home's value as well as a comparison with similar homes in the area
Home Values in the Area
Average Home Value in this Area
Purchase History
| Date | Buyer | Sale Price | Title Company |
|---|---|---|---|
| Sangha Navdeep K | -- | None Listed On Document | |
| Kailley Sukhdev Singh | $293,000 | Servicelink | |
| Kailley Sukhdev Singh | -- | None Available | |
| Kaur Jaspreet | $645,000 | Fidelity National Title Co | |
| Fleck Charles H | $427,000 | First American Title Guarant |
Source: Public Records
Mortgage History
| Date | Status | Borrower | Loan Amount |
|---|---|---|---|
| Previous Owner | Kailley Sukhdev Singh | $285,000 | |
| Previous Owner | Kaur Jaspreet | $450,000 | |
| Previous Owner | Fleck Charles H | $341,444 |
Source: Public Records
Tax History
| Year | Tax Paid | Tax Assessment Tax Assessment Total Assessment is a certain percentage of the fair market value that is determined by local assessors to be the total taxable value of land and additions on the property. | Land | Improvement |
|---|---|---|---|---|
| 2025 | $13,262 | $916,973 | $277,192 | $646,781 |
| 2024 | $13,262 | $898,860 | $271,758 | $634,102 |
| 2023 | $12,871 | $888,101 | $266,430 | $621,671 |
| 2022 | $12,661 | $863,690 | $261,207 | $609,483 |
| 2021 | $12,381 | $846,621 | $256,086 | $597,535 |
| 2020 | $12,095 | $844,873 | $253,462 | $591,411 |
| 2019 | $12,206 | $828,310 | $248,493 | $579,817 |
| 2018 | $11,928 | $812,074 | $243,622 | $568,452 |
| 2017 | $11,647 | $796,152 | $238,845 | $557,307 |
| 2016 | $10,282 | $703,294 | $210,988 | $492,306 |
| 2015 | $10,089 | $692,735 | $207,820 | $484,915 |
| 2014 | $9,719 | $679,171 | $203,751 | $475,420 |
Source: Public Records
Map
Nearby Homes
- 33941 9th St
- 645 F St
- 33554 7th St
- 33638 9th St
- 33848 10th St
- 33840 10th St
- 33853 10th St
- 33721 12th St
- 110 Pear Ln
- 267 Famoso Plaza
- 235 Famoso Plaza
- 245 Famoso Plaza
- 35185 11th St Unit 274
- 33528 13th St
- 152 Aurora Plaza
- 116 Mahogany Ln
- 352 Monte Carlo Ave
- 165 Aurora Plaza
- 1059 Sapphire Terrace Unit 353
- 1085 La Brea Terrace
- 34236 Aspen Loop
- 34228 Aspen Loop
- 34233 Myrtle Ln
- 34237 Myrtle Ln
- 34229 Myrtle Ln
- 34240 Aspen Loop
- 34224 Aspen Loop
- 34241 Myrtle Ln
- 34233 Aspen Loop
- 34225 Myrtle Ln
- 34229 Aspen Loop
- 34237 Aspen Loop
- 34244 Aspen Loop
- 34220 Aspen Loop
- 34225 Aspen Loop
- 34245 Myrtle Ln
- 34221 Myrtle Ln
- 34241 Aspen Loop
- 34221 Aspen Loop
- 34248 Aspen Loop
Your Personal Tour Guide
Ask me questions while you tour the home.