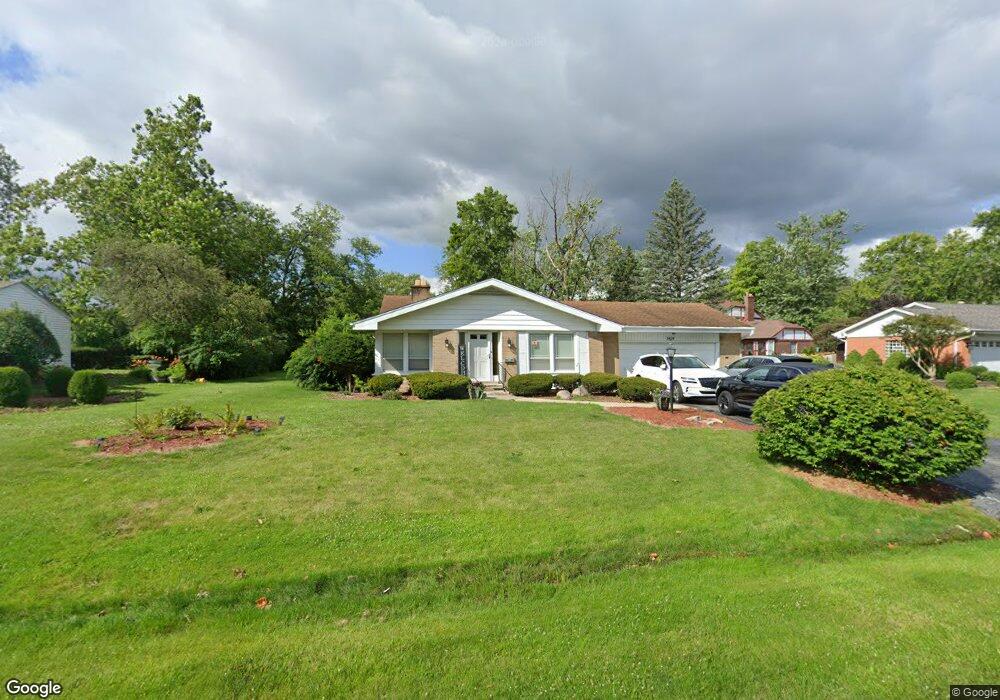
3424 Ithaca Rd Olympia Fields, IL 60461
Estimated Value: $268,000 - $318,000
3
Beds
2
Baths
1,937
Sq Ft
$148/Sq Ft
Est. Value
About This Home
This home is located at 3424 Ithaca Rd, Olympia Fields, IL 60461 and is currently estimated at $286,519, approximately $147 per square foot. 3424 Ithaca Rd is a home located in Cook County with nearby schools including Illinois School, Arcadia Elementary School, and Indiana Elementary School.
Ownership History
Date
Name
Owned For
Owner Type
Purchase Details
Closed on
May 7, 2019
Sold by
Hutcherson Pamala and Cooks Pamala
Bought by
Owens Antonea L and Owens Johnard J
Current Estimated Value
Home Financials for this Owner
Home Financials are based on the most recent Mortgage that was taken out on this home.
Original Mortgage
$157,076
Outstanding Balance
$137,388
Interest Rate
4.25%
Mortgage Type
FHA
Estimated Equity
$149,131
Purchase Details
Closed on
Aug 14, 2006
Sold by
Finch Carl Preston and Finch Ramona
Bought by
Cooks Pamala
Home Financials for this Owner
Home Financials are based on the most recent Mortgage that was taken out on this home.
Original Mortgage
$188,770
Interest Rate
6.88%
Mortgage Type
Purchase Money Mortgage
Purchase Details
Closed on
Mar 27, 2006
Sold by
Finch Carl P and Finch Ramona
Bought by
Finch Carl Preston and Finch Ramona
Purchase Details
Closed on
Feb 9, 1999
Sold by
Belford Ruth H
Bought by
Finch Carl P and Finch Ramona
Create a Home Valuation Report for This Property
The Home Valuation Report is an in-depth analysis detailing your home's value as well as a comparison with similar homes in the area
Home Values in the Area
Average Home Value in this Area
Purchase History
| Date | Buyer | Sale Price | Title Company |
|---|---|---|---|
| Owens Antonea L | $162,500 | Chicago Title | |
| Cooks Pamala | $195,000 | Atgf Inc | |
| Finch Carl Preston | -- | None Available | |
| Finch Carl P | $149,500 | -- |
Source: Public Records
Mortgage History
| Date | Status | Borrower | Loan Amount |
|---|---|---|---|
| Open | Owens Antonea L | $157,076 | |
| Previous Owner | Cooks Pamala | $188,770 |
Source: Public Records
Tax History
| Year | Tax Paid | Tax Assessment Tax Assessment Total Assessment is a certain percentage of the fair market value that is determined by local assessors to be the total taxable value of land and additions on the property. | Land | Improvement |
|---|---|---|---|---|
| 2025 | $10,443 | $24,000 | $6,711 | $17,289 |
| 2024 | $10,443 | $24,000 | $6,711 | $17,289 |
| 2023 | $9,229 | $24,000 | $6,711 | $17,289 |
| 2022 | $9,229 | $16,251 | $5,922 | $10,329 |
| 2021 | $9,158 | $16,250 | $5,921 | $10,329 |
| 2020 | $8,371 | $16,250 | $5,921 | $10,329 |
| 2019 | $7,623 | $17,976 | $5,526 | $12,450 |
| 2018 | $7,566 | $17,976 | $5,526 | $12,450 |
| 2017 | $7,344 | $17,976 | $5,526 | $12,450 |
| 2016 | $6,779 | $15,996 | $5,132 | $10,864 |
| 2015 | $7,064 | $16,735 | $5,132 | $11,603 |
| 2014 | $6,931 | $16,735 | $5,132 | $11,603 |
| 2013 | $6,969 | $18,245 | $5,132 | $13,113 |
Source: Public Records
Map
Nearby Homes
- 3506 Ithaca Rd
- 3451 Ithaca Rd
- 20415 Doria Ln
- 20436 Arcadian Dr
- 20535 Marathon Ct
- 20920 Governors Hwy
- 3415 Vollmer Rd Unit 308
- 3507 Park Place
- 20001 Arquilla Cir
- 3427 Vollmer Rd Unit 205
- 3427 Vollmer Rd Unit 202
- 3427 Vollmer Rd Unit 209
- 20015 Delphi Dr
- 2904 Athena Ct
- 2908 Athena Ct
- 2935 Dartmouth Ln
- 2925 Dartmouth Ln
- 1816 Quail Ct
- 4141 204th St
- 3133 Nottingham Ct
- 3416 Ithaca Rd
- 20345 Arcadian Dr
- 3432 Ithaca Rd
- 3435 Attica Rd
- 3408 Ithaca Rd
- 3443 Attica Rd
- 3417 Ithaca Rd
- 3431 Attica Rd
- 3425 Ithaca Rd
- 3433 Ithaca Rd
- 20325 Arcadian Dr
- 20338 Achilles Ave
- 20400 Achilles Ave
- 20342 Arcadian Dr
- 20423 Attica Rd
- 20332 Arcadian Dr
- 20414 Achilles Ave
- 20330 Achilles Ave
- 3501 Doria Ln
- 3442 Attica Rd
Your Personal Tour Guide
Ask me questions while you tour the home.