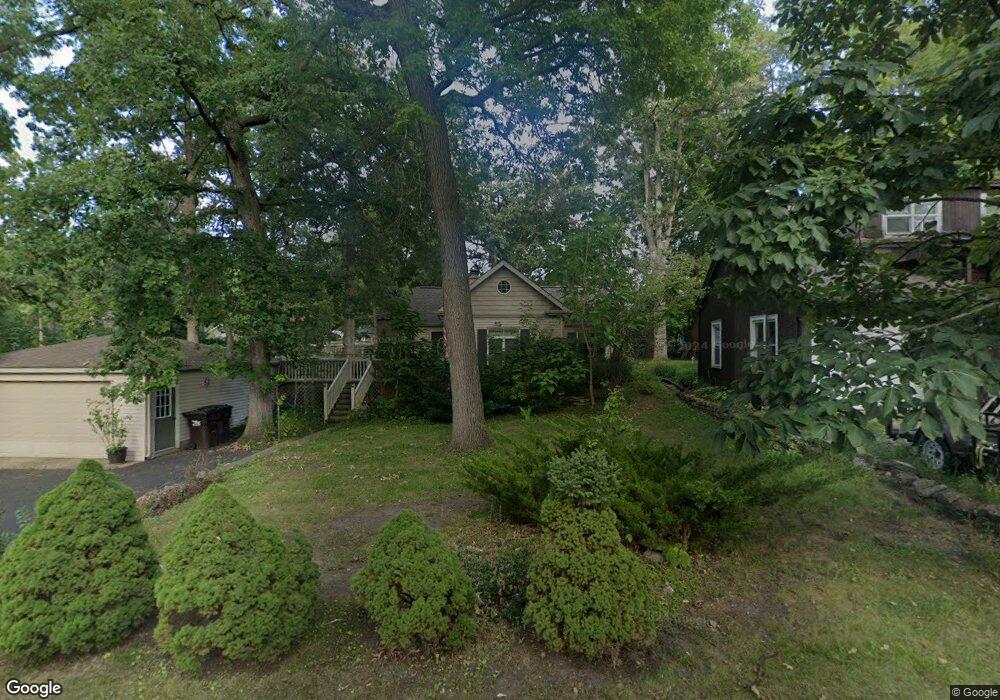
3424 Locust Ave Island Lake, IL 60042
East Island Lake NeighborhoodEstimated Value: $169,096 - $227,000
2
Beds
1
Bath
700
Sq Ft
$300/Sq Ft
Est. Value
About This Home
This home is located at 3424 Locust Ave, Island Lake, IL 60042 and is currently estimated at $210,024, approximately $300 per square foot. 3424 Locust Ave is a home located in Lake County with nearby schools including Cotton Creek School, Matthews Middle School, and Wauconda High School.
Ownership History
Date
Name
Owned For
Owner Type
Purchase Details
Closed on
Apr 25, 2006
Sold by
Wright Jeffrey A
Bought by
Gofman Leonid
Current Estimated Value
Home Financials for this Owner
Home Financials are based on the most recent Mortgage that was taken out on this home.
Original Mortgage
$100,000
Outstanding Balance
$57,566
Interest Rate
6.39%
Mortgage Type
Fannie Mae Freddie Mac
Estimated Equity
$152,458
Purchase Details
Closed on
Dec 4, 1998
Sold by
Roder Christian B and Roder Priscilla J
Bought by
Wright Jeffrey A
Home Financials for this Owner
Home Financials are based on the most recent Mortgage that was taken out on this home.
Original Mortgage
$107,567
Interest Rate
6.83%
Mortgage Type
FHA
Purchase Details
Closed on
Dec 27, 1996
Sold by
Poirier Alanna and Larson Michael
Bought by
Roder Christian B and Roder Priscilla J
Home Financials for this Owner
Home Financials are based on the most recent Mortgage that was taken out on this home.
Original Mortgage
$43,400
Interest Rate
7.64%
Create a Home Valuation Report for This Property
The Home Valuation Report is an in-depth analysis detailing your home's value as well as a comparison with similar homes in the area
Home Values in the Area
Average Home Value in this Area
Purchase History
| Date | Buyer | Sale Price | Title Company |
|---|---|---|---|
| Gofman Leonid | $149,000 | Stewart Title Company | |
| Wright Jeffrey A | $108,500 | Plm Title Company | |
| Roder Christian B | $62,000 | Ticor Title Insurance Compan |
Source: Public Records
Mortgage History
| Date | Status | Borrower | Loan Amount |
|---|---|---|---|
| Open | Gofman Leonid | $100,000 | |
| Previous Owner | Wright Jeffrey A | $107,567 | |
| Previous Owner | Roder Christian B | $43,400 |
Source: Public Records
Tax History Compared to Growth
Tax History
| Year | Tax Paid | Tax Assessment Tax Assessment Total Assessment is a certain percentage of the fair market value that is determined by local assessors to be the total taxable value of land and additions on the property. | Land | Improvement |
|---|---|---|---|---|
| 2024 | $913 | $50,237 | $9,801 | $40,436 |
| 2023 | $913 | $41,747 | $8,145 | $33,602 |
| 2022 | $1,491 | $39,330 | $10,510 | $28,820 |
| 2021 | $1,513 | $37,163 | $9,931 | $27,232 |
| 2020 | $1,538 | $35,420 | $9,465 | $25,955 |
| 2019 | $1,420 | $33,475 | $8,945 | $24,530 |
| 2018 | $1,592 | $30,724 | $8,809 | $21,915 |
| 2017 | $1,600 | $30,369 | $8,707 | $21,662 |
| 2016 | $1,614 | $28,758 | $8,245 | $20,513 |
| 2015 | $1,674 | $26,400 | $7,569 | $18,831 |
| 2014 | $2,685 | $26,392 | $8,015 | $18,377 |
| 2012 | $2,644 | $30,389 | $7,668 | $22,721 |
Source: Public Records
Map
Nearby Homes
- 236 Forest Dr
- lot 23 Park Dr
- 216 S Shore Dr Unit S
- 228 S Shore Dr
- NEC Route 176 & Westridge Dr
- 3819 Woodlawn Dr
- 3828 Eastway Dr
- 318 David Ct
- 00 Burnett Rd
- 404 Lauren Ln
- 706 E Burnett Rd
- 244 Red Oak Ct
- 27692 N Oak St
- 811 Newport Dr
- 2448 Fen View Cir
- 3625 Newport Dr
- 27569 N Beech St
- 4342 Shooting Star Dr Unit 142
- 2610 S Thomas Ct
- 833 Dartmouth Dr Unit 7
- 3426 Locust Ave
- 3421 Oakwood Dr
- 3425 Oakwood Dr
- 3419 Oakwood Dr
- 3426 Brierhill Dr
- 213 Forest Dr
- 217 Forest Dr
- 3508 Brierhill Dr
- 3424 Brierhill Dr
- 3503 Oakwood Dr
- 3417 Oakwood Dr
- 205 Forest Dr
- 3420 Brierhill Dr
- 3420 Brierhill Dr
- 221 Forest Dr
- 203 Forest Dr
- 3422 Oakwood Dr
- 3502 Oakwood Dr
- 3509 Oakwood Dr
- 3418 Oakwood Dr