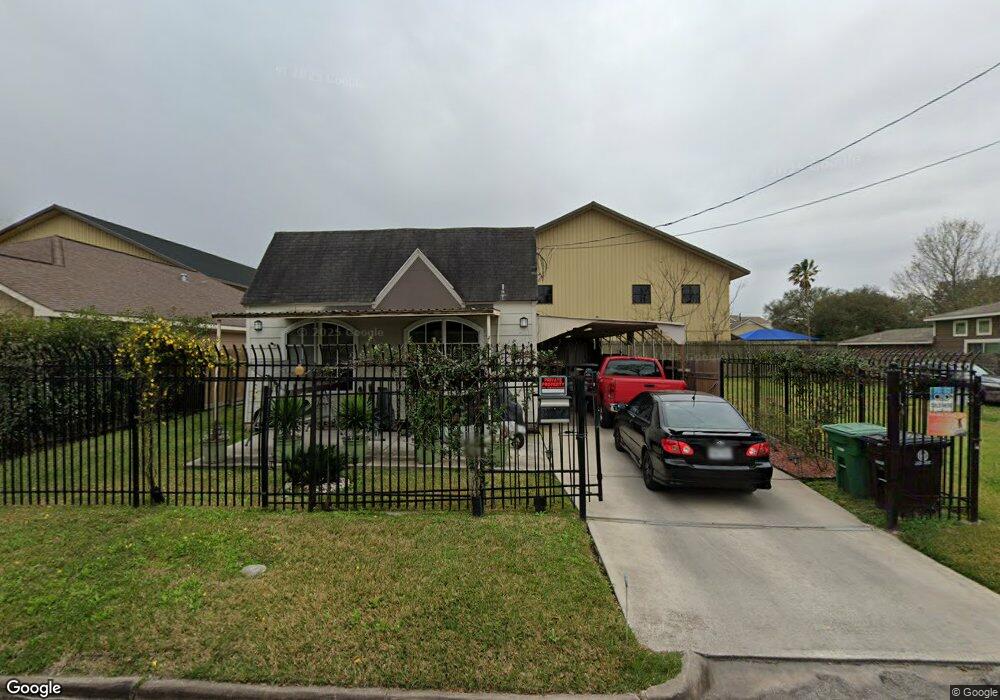
3424 Tampa St Unit B Houston, TX 77021
MacGregor NeighborhoodEstimated Value: $233,593 - $307,000
2
Beds
2
Baths
1,200
Sq Ft
$216/Sq Ft
Est. Value
About This Home
This home is located at 3424 Tampa St Unit B, Houston, TX 77021 and is currently estimated at $259,148, approximately $215 per square foot. 3424 Tampa St Unit B is a home located in Harris County with nearby schools including Thompson Elementary School, Cullen Middle School, and Yates High School.
Ownership History
Date
Name
Owned For
Owner Type
Purchase Details
Closed on
Nov 11, 2014
Sold by
The Readigroup Inc
Bought by
Olowonira David A and Olowonira Evelyn
Current Estimated Value
Home Financials for this Owner
Home Financials are based on the most recent Mortgage that was taken out on this home.
Original Mortgage
$72,000
Outstanding Balance
$20,172
Interest Rate
4.21%
Mortgage Type
New Conventional
Estimated Equity
$238,976
Purchase Details
Closed on
Oct 16, 2013
Sold by
Johnson Foster Devan D and Johnson Foster Desmond D
Bought by
The Readigroup Inc and Fornaca Enterprises Inc
Purchase Details
Closed on
Oct 26, 2012
Sold by
Johnson Oscar and Johnson Ruthie J
Bought by
Johnson Foster Devan D and Johnson Foster Desmond D
Purchase Details
Closed on
Jun 28, 2010
Sold by
Johnson Oscar and Johnson Ruthie J
Bought by
Johnson Foster Devan D and Johnson Foster Desmond D
Create a Home Valuation Report for This Property
The Home Valuation Report is an in-depth analysis detailing your home's value as well as a comparison with similar homes in the area
Home Values in the Area
Average Home Value in this Area
Purchase History
| Date | Buyer | Sale Price | Title Company |
|---|---|---|---|
| Olowonira David A | -- | Alamo Title Co | |
| The Readigroup Inc | -- | None Available | |
| Johnson Foster Devan D | -- | None Available | |
| Johnson Foster Devan D | -- | None Available |
Source: Public Records
Mortgage History
| Date | Status | Borrower | Loan Amount |
|---|---|---|---|
| Open | Olowonira David A | $72,000 |
Source: Public Records
Tax History Compared to Growth
Tax History
| Year | Tax Paid | Tax Assessment Tax Assessment Total Assessment is a certain percentage of the fair market value that is determined by local assessors to be the total taxable value of land and additions on the property. | Land | Improvement |
|---|---|---|---|---|
| 2025 | $4,321 | $194,259 | $163,317 | $30,942 |
| 2024 | $4,321 | $206,536 | $163,317 | $43,219 |
| 2023 | $4,321 | $175,681 | $130,487 | $45,194 |
| 2022 | $4,364 | $188,366 | $138,572 | $49,794 |
| 2021 | $3,285 | $140,953 | $94,031 | $46,922 |
| 2020 | $3,503 | $138,081 | $94,031 | $44,050 |
| 2019 | $3,504 | $132,449 | $94,031 | $38,418 |
| 2018 | $2,741 | $108,331 | $72,008 | $36,323 |
| 2017 | $2,628 | $99,423 | $63,100 | $36,323 |
| 2016 | $2,103 | $79,542 | $48,253 | $31,289 |
| 2015 | $1,562 | $65,711 | $34,643 | $31,068 |
| 2014 | $1,562 | $60,774 | $34,643 | $26,131 |
Source: Public Records
Map
Nearby Homes
- 3379 Tampa St
- 3371 Dixie Dr
- 3368 Dixie Dr
- 3417 Charleston St
- 3415 Charleston St
- 3523 Tampa St
- 6324 Del Rio St
- 6411 Illinois St
- 3539 Tampa St
- 6348 Culberson St
- 3343 Dixie Dr
- 6350 Culberson St
- 3519 Old Spanish Trail
- 3551 Tampa St
- 3530 Griggs Rd
- 3339 Kilgore St
- 3333 Kilgore St
- 6336 Del Rio St
- 3327 Kilgore St Unit F
- 3334 Kilgore St
- 3424 Tampa St
- 3424 Tampa St Unit 2 units
- 3432 Tampa St
- 3422 Tampa St
- 3418 Tampa St
- 3436 Tampa St
- 3414 Tampa St
- 3425 Tampa St
- 3429 Tampa St
- 3440 Tampa St
- 3421 Tampa St
- 3421 Tampa St Unit G
- 3421 Tampa St Unit F
- 3421 Tampa St Unit C
- 3421 Tampa St Unit B
- 3421 Tampa St Unit D
- 3417 Tampa St
- 3437 Tampa St
- 3410 Tampa St
- 3413 Tampa St