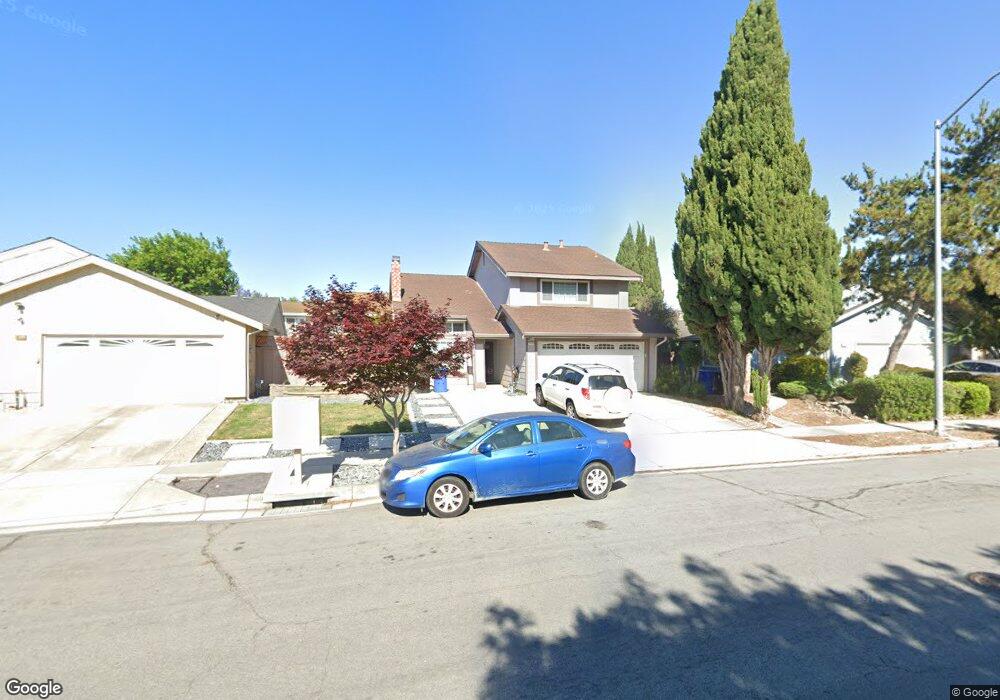
34243 Siward Dr Fremont, CA 94555
Ardenwood NeighborhoodEstimated Value: $1,752,869 - $1,817,000
3
Beds
3
Baths
1,717
Sq Ft
$1,040/Sq Ft
Est. Value
About This Home
This home is located at 34243 Siward Dr, Fremont, CA 94555 and is currently estimated at $1,785,467, approximately $1,039 per square foot. 34243 Siward Dr is a home located in Alameda County with nearby schools including Ardenwood Elementary, Thornton Middle School, and American High School.
Ownership History
Date
Name
Owned For
Owner Type
Purchase Details
Closed on
Aug 29, 2012
Sold by
Chow Florence and Wong Danny Gaa Nung
Bought by
Chow Florence and Wong Danny Gaa Nung
Current Estimated Value
Home Financials for this Owner
Home Financials are based on the most recent Mortgage that was taken out on this home.
Original Mortgage
$262,000
Interest Rate
3.47%
Mortgage Type
New Conventional
Purchase Details
Closed on
Jul 15, 2008
Sold by
Lawas Lawas Sergio L Sergio L and Lawas Hugo Susan
Bought by
Chow Florence and Wong Danny Gaa Nung
Home Financials for this Owner
Home Financials are based on the most recent Mortgage that was taken out on this home.
Original Mortgage
$323,000
Interest Rate
6.42%
Mortgage Type
Purchase Money Mortgage
Purchase Details
Closed on
Mar 18, 2008
Sold by
Lawas Sergio L and 1993 Lawas Living Trust
Bought by
Lawas Lawas Sergio L Sergio L and Lawas Hugo Susan
Purchase Details
Closed on
Jan 21, 1999
Sold by
Lawas Sergio L and Lawas Paciencia N
Bought by
Lawas Sergio L and Lawas Paciencia N
Create a Home Valuation Report for This Property
The Home Valuation Report is an in-depth analysis detailing your home's value as well as a comparison with similar homes in the area
Home Values in the Area
Average Home Value in this Area
Purchase History
| Date | Buyer | Sale Price | Title Company |
|---|---|---|---|
| Chow Florence | -- | Stewart Title Of California | |
| Chow Florence | $615,000 | Financial Title Company | |
| Lawas Lawas Sergio L Sergio L | -- | None Available | |
| Lawas Sergio L | -- | -- |
Source: Public Records
Mortgage History
| Date | Status | Borrower | Loan Amount |
|---|---|---|---|
| Closed | Chow Florence | $262,000 | |
| Closed | Chow Florence | $323,000 |
Source: Public Records
Tax History Compared to Growth
Tax History
| Year | Tax Paid | Tax Assessment Tax Assessment Total Assessment is a certain percentage of the fair market value that is determined by local assessors to be the total taxable value of land and additions on the property. | Land | Improvement |
|---|---|---|---|---|
| 2025 | $9,616 | $791,916 | $237,575 | $554,341 |
| 2024 | $9,616 | $776,394 | $232,918 | $543,476 |
| 2023 | $9,358 | $761,172 | $228,351 | $532,821 |
| 2022 | $9,236 | $746,252 | $223,875 | $522,377 |
| 2021 | $9,011 | $731,621 | $219,486 | $512,135 |
| 2020 | $9,030 | $724,124 | $217,237 | $506,887 |
| 2019 | $8,928 | $709,930 | $212,979 | $496,951 |
| 2018 | $8,755 | $696,013 | $208,804 | $487,209 |
| 2017 | $8,537 | $682,366 | $204,710 | $477,656 |
| 2016 | $8,392 | $668,990 | $200,697 | $468,293 |
| 2015 | $8,280 | $658,947 | $197,684 | $461,263 |
| 2014 | $8,138 | $646,044 | $193,813 | $452,231 |
Source: Public Records
Map
Nearby Homes
- 4512 Macbeth Ave
- 4516 Roderigo Ct
- 4480 Norocco Cir
- 4243 Nerissa Cir
- 34768 Swain Common
- 34648 Musk Terrace
- 34579 Bluestone Common
- 34627 Pueblo Terrace
- 34607 Pueblo Terrace
- 34565 Pueblo Terrace
- 34656 Greenstone Common
- 3840 Springfield Common
- 34512 Nantucket Common
- 34552 Nantucket Common
- 34771 Tuxedo Common Unit 52
- 4141 Deep Creek Rd Unit 137
- 5301 Shamrock Common
- 3851 Milton Terrace
- 4015 Clydesdale Common
- 5176 Tacoma Common
- 34235 Siward Dr
- 34251 Siward Dr
- 34198 Duke Ln
- 34190 Duke Ln
- 34227 Siward Dr
- 34184 Duke Ln
- 34259 Siward Dr
- 4640 Phebe Ave
- 34178 Duke Ln
- 34228 Siward Dr
- 34219 Siward Dr
- 34220 Siward Dr
- 34174 Duke Ln
- 34244 Siward Dr
- 34267 Siward Dr
- 4648 Phebe Ave
- 4647 Paseo Padre Pkwy
- 34212 Siward Dr
- 34166 Duke Ln
- 34211 Siward Dr