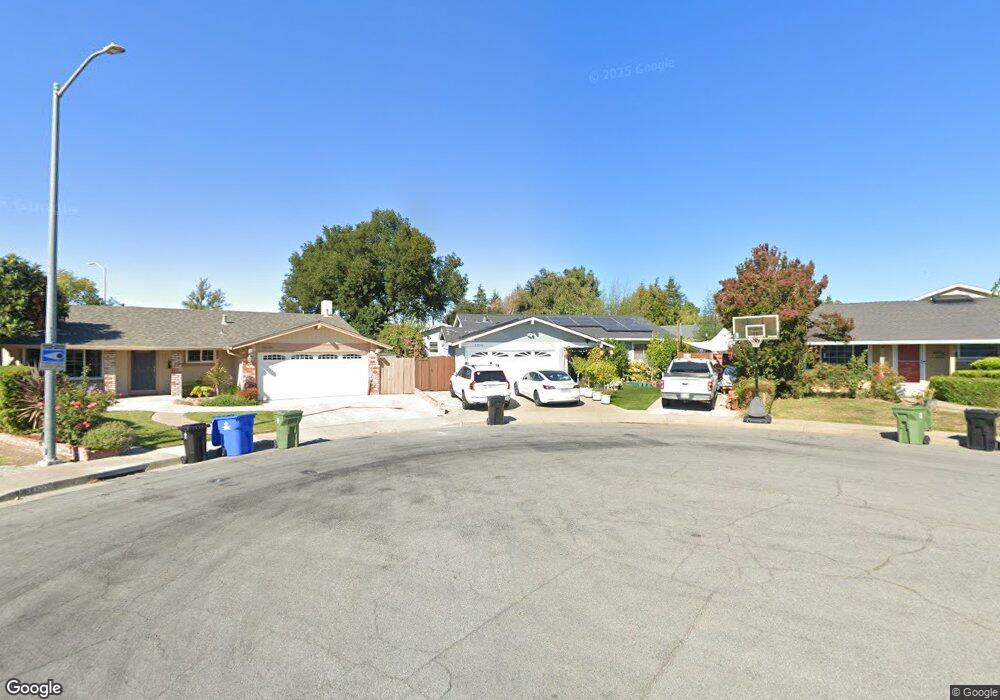
34244 Newton Place Fremont, CA 94555
Northgate-Union City NeighborhoodEstimated Value: $1,734,000 - $1,952,859
3
Beds
2
Baths
1,305
Sq Ft
$1,390/Sq Ft
Est. Value
About This Home
This home is located at 34244 Newton Place, Fremont, CA 94555 and is currently estimated at $1,814,465, approximately $1,390 per square foot. 34244 Newton Place is a home located in Alameda County with nearby schools including Warwick Elementary School, Thornton Middle School, and American High School.
Ownership History
Date
Name
Owned For
Owner Type
Purchase Details
Closed on
Jul 17, 2018
Sold by
Bowman Yvonne and Bowman David M
Bought by
Ruan Wenjin and Li Yuan
Current Estimated Value
Home Financials for this Owner
Home Financials are based on the most recent Mortgage that was taken out on this home.
Original Mortgage
$661,000
Outstanding Balance
$566,330
Interest Rate
4%
Mortgage Type
Adjustable Rate Mortgage/ARM
Estimated Equity
$1,248,135
Purchase Details
Closed on
Oct 23, 2006
Sold by
Kelly Yvonne
Bought by
Kelly Yvonne and Bowman David M
Purchase Details
Closed on
Jul 24, 2006
Sold by
Melvin Tobe and Pearl Elizabeth Epperhelme
Bought by
Kelly Yvonne
Home Financials for this Owner
Home Financials are based on the most recent Mortgage that was taken out on this home.
Original Mortgage
$98,250
Interest Rate
6.69%
Mortgage Type
Stand Alone Second
Create a Home Valuation Report for This Property
The Home Valuation Report is an in-depth analysis detailing your home's value as well as a comparison with similar homes in the area
Home Values in the Area
Average Home Value in this Area
Purchase History
| Date | Buyer | Sale Price | Title Company |
|---|---|---|---|
| Ruan Wenjin | $1,300,000 | Old Republic Title Company | |
| Kelly Yvonne | $330,000 | Cornerstone Title Co | |
| Kelly Yvonne | $660,000 | First American Title |
Source: Public Records
Mortgage History
| Date | Status | Borrower | Loan Amount |
|---|---|---|---|
| Open | Ruan Wenjin | $661,000 | |
| Previous Owner | Kelly Yvonne | $98,250 |
Source: Public Records
Tax History Compared to Growth
Tax History
| Year | Tax Paid | Tax Assessment Tax Assessment Total Assessment is a certain percentage of the fair market value that is determined by local assessors to be the total taxable value of land and additions on the property. | Land | Improvement |
|---|---|---|---|---|
| 2025 | $18,070 | $1,553,387 | $435,045 | $1,125,342 |
| 2024 | $18,070 | $1,522,795 | $426,515 | $1,103,280 |
| 2023 | $17,605 | $1,499,804 | $418,154 | $1,081,650 |
| 2022 | $17,404 | $1,463,401 | $409,956 | $1,060,445 |
| 2021 | $15,366 | $1,293,000 | $390,000 | $910,000 |
| 2020 | $17,106 | $1,426,800 | $397,800 | $1,029,000 |
| 2019 | $15,750 | $1,300,000 | $390,000 | $910,000 |
| 2018 | $9,704 | $777,110 | $233,133 | $543,977 |
| 2017 | $9,462 | $761,877 | $228,563 | $533,314 |
| 2016 | $9,303 | $746,941 | $224,082 | $522,859 |
| 2015 | $9,182 | $735,727 | $220,718 | $515,009 |
| 2014 | $8,020 | $636,000 | $190,800 | $445,200 |
Source: Public Records
Map
Nearby Homes
- 34233 Atteridge Place
- 34179 Bowling Green Common
- 33911 Mello Way
- 3840 Springfield Common
- 3851 Milton Terrace
- 4015 Clydesdale Common
- 3134 Warwick Rd
- 2835 Beard Terrace
- 34552 Nantucket Common
- 34512 Nantucket Common
- 3691 Thrush Terrace
- 34926 Moina Shaiq Common
- 3480 Oriole Place
- 34656 Greenstone Common
- 34579 Bluestone Common
- 33845 Washington Ave
- 34917 Sea Cliff Terrace
- 2421 Maraschino Place
- 4243 Nerissa Cir
- 3184 Waugh Place
- 34236 Newton Place
- 34231 Torrington Place
- 34272 Newton Place
- 34203 Torrington Place
- 34259 Torrington Place
- 34298 Newton Place
- 34235 Newton Place
- 34287 Torrington Place
- 34243 Newton Place
- 34200 Torrington Place
- 34271 Newton Place
- 34297 Newton Place
- 34310 Newton Ct
- 34260 Torrington Place
- 34204 Torrington Place
- 34236 Auckland Place
- 3299 Langhorn Dr
- 34232 Torrington Place
- 34307 Torrington Ct
- 34254 Auckland Place