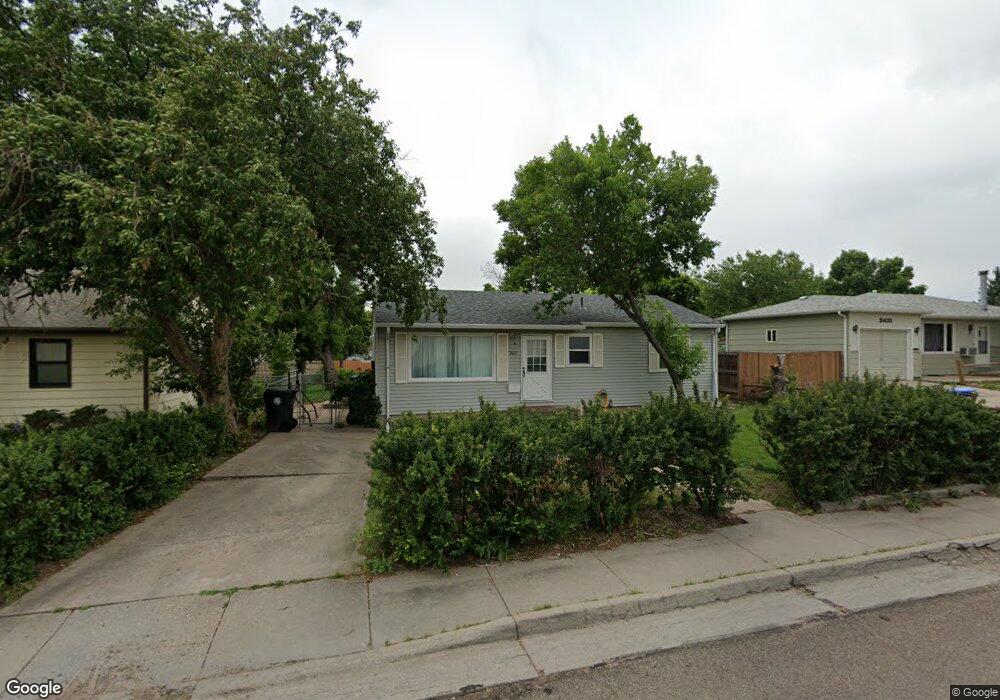
3425 E 12th St Cheyenne, WY 82001
Sun Valley NeighborhoodEstimated Value: $271,212 - $292,000
3
Beds
1
Bath
912
Sq Ft
$309/Sq Ft
Est. Value
About This Home
This home is located at 3425 E 12th St, Cheyenne, WY 82001 and is currently estimated at $281,553, approximately $308 per square foot. 3425 E 12th St is a home located in Laramie County with nearby schools including Lebhart Elementary School, Fairview Elementary School, and Johnson Junior High School.
Ownership History
Date
Name
Owned For
Owner Type
Purchase Details
Closed on
Aug 30, 2019
Sold by
Lesh Shannon and Lesh Fernandez Shannon
Bought by
Wills Vickey K
Current Estimated Value
Home Financials for this Owner
Home Financials are based on the most recent Mortgage that was taken out on this home.
Original Mortgage
$164,250
Outstanding Balance
$144,455
Interest Rate
3.8%
Mortgage Type
New Conventional
Estimated Equity
$137,098
Purchase Details
Closed on
Feb 26, 2002
Sold by
Kushnir Cynthia A
Bought by
Hodgeman Melony L
Home Financials for this Owner
Home Financials are based on the most recent Mortgage that was taken out on this home.
Original Mortgage
$78,764
Interest Rate
6.81%
Mortgage Type
FHA
Purchase Details
Closed on
May 27, 1998
Sold by
Maestas Michael L and Maestas Cathie
Bought by
Kushnir Cynthia A
Home Financials for this Owner
Home Financials are based on the most recent Mortgage that was taken out on this home.
Original Mortgage
$64,673
Interest Rate
7.22%
Mortgage Type
FHA
Create a Home Valuation Report for This Property
The Home Valuation Report is an in-depth analysis detailing your home's value as well as a comparison with similar homes in the area
Home Values in the Area
Average Home Value in this Area
Purchase History
| Date | Buyer | Sale Price | Title Company |
|---|---|---|---|
| Wills Vickey K | -- | First American | |
| Hodgeman Melony L | -- | -- | |
| Kushnir Cynthia A | -- | -- |
Source: Public Records
Mortgage History
| Date | Status | Borrower | Loan Amount |
|---|---|---|---|
| Open | Wills Vickey K | $164,250 | |
| Previous Owner | Hodgeman Melony L | $78,764 | |
| Previous Owner | Kushnir Cynthia A | $64,673 | |
| Closed | Hodgeman Melony L | $4,495 |
Source: Public Records
Tax History
| Year | Tax Paid | Tax Assessment Tax Assessment Total Assessment is a certain percentage of the fair market value that is determined by local assessors to be the total taxable value of land and additions on the property. | Land | Improvement |
|---|---|---|---|---|
| 2025 | $1,157 | $12,634 | $3,284 | $9,350 |
| 2024 | $1,157 | $16,358 | $4,378 | $11,980 |
| 2023 | $1,150 | $16,260 | $4,378 | $11,882 |
| 2022 | $1,101 | $15,259 | $4,378 | $10,881 |
| 2021 | $1,035 | $14,301 | $4,378 | $9,923 |
| 2020 | $967 | $13,407 | $4,378 | $9,029 |
| 2019 | $903 | $12,513 | $4,378 | $8,135 |
| 2018 | $806 | $11,266 | $3,638 | $7,628 |
| 2017 | $760 | $10,524 | $2,935 | $7,589 |
| 2016 | $642 | $8,888 | $2,889 | $5,999 |
| 2015 | $598 | $8,274 | $2,889 | $5,385 |
| 2014 | $598 | $8,230 | $2,889 | $5,341 |
Source: Public Records
Map
Nearby Homes
- 3505 E 12th St
- 909 Ridge Rd
- 3331 Belaire Ave
- 810 Cahill Dr
- Lot 2 E 13th St
- 840 Stevens Dr
- 901 Coolidge St
- 3518 Randy Rd
- 3069 Hanson St
- 3524 Frontier St
- 7723 Three Hearts Trail
- 3425 Myers Ct
- 3319 Myers Ct
- 3513 Holmes St
- 1608 Madison Ave
- 3248 Acacia Dr
- 3212 Acacia Dr
- 1103 Cactus Hill Rd
- TBD Atkin St
- 4612 E 6th St
- 3421 E 12th St
- 3433 E 12th St
- 3417 E 12th St
- 3424 E 11th St
- 3420 E 11th St
- 3413 E 12th St
- 3432 E 11th St
- 3416 E 11th St
- 3437 E 12th St
- 3412 E 11th St
- 3436 E 11th St
- 3409 E 12th St
- 3408 E 11th St
- 3405 E 12th St
- 3425 E 11th St
- 1111 Kingham Dr
- 3404 E 11th St
- 1008 Kingham Dr
- 1101 Kingham Dr
- 1010 Worth Dr
Your Personal Tour Guide
Ask me questions while you tour the home.