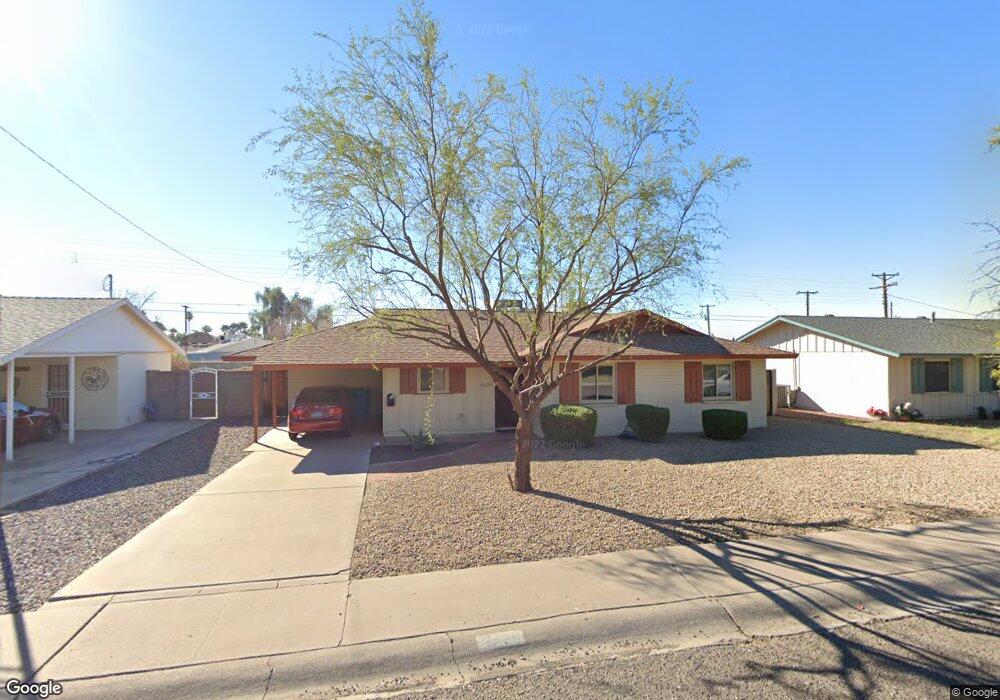
3425 W Alice Ave Phoenix, AZ 85051
North Mountain Village NeighborhoodEstimated Value: $284,993 - $360,000
3
Beds
2
Baths
1,684
Sq Ft
$197/Sq Ft
Est. Value
About This Home
This home is located at 3425 W Alice Ave, Phoenix, AZ 85051 and is currently estimated at $331,748, approximately $197 per square foot. 3425 W Alice Ave is a home located in Maricopa County with nearby schools including Palo Verde Middle School, Alta Vista Elementary School, and Cortez High School.
Ownership History
Date
Name
Owned For
Owner Type
Purchase Details
Closed on
Jun 30, 2004
Sold by
Conwell Randy E and Conwell Regona K
Bought by
Walle Deborah
Current Estimated Value
Home Financials for this Owner
Home Financials are based on the most recent Mortgage that was taken out on this home.
Original Mortgage
$119,900
Outstanding Balance
$60,174
Interest Rate
6.29%
Mortgage Type
New Conventional
Estimated Equity
$271,574
Purchase Details
Closed on
Jun 29, 2000
Sold by
Seidel Dennis E
Bought by
Conwell Randy E and Tyree Regona K
Home Financials for this Owner
Home Financials are based on the most recent Mortgage that was taken out on this home.
Original Mortgage
$91,049
Interest Rate
8.67%
Mortgage Type
FHA
Purchase Details
Closed on
Jan 10, 1996
Sold by
Maturani Alexander John and Maturani Tina L
Bought by
Seidel Dennis E
Home Financials for this Owner
Home Financials are based on the most recent Mortgage that was taken out on this home.
Original Mortgage
$70,552
Interest Rate
7.25%
Mortgage Type
FHA
Create a Home Valuation Report for This Property
The Home Valuation Report is an in-depth analysis detailing your home's value as well as a comparison with similar homes in the area
Home Values in the Area
Average Home Value in this Area
Purchase History
| Date | Buyer | Sale Price | Title Company |
|---|---|---|---|
| Walle Deborah | $119,900 | Westland Title Agency Of Az | |
| Conwell Randy E | $91,800 | Ati Title Agency | |
| Seidel Dennis E | $71,000 | Fidelity Title |
Source: Public Records
Mortgage History
| Date | Status | Borrower | Loan Amount |
|---|---|---|---|
| Open | Walle Deborah | $119,900 | |
| Previous Owner | Conwell Randy E | $91,049 | |
| Previous Owner | Seidel Dennis E | $70,552 |
Source: Public Records
Tax History Compared to Growth
Tax History
| Year | Tax Paid | Tax Assessment Tax Assessment Total Assessment is a certain percentage of the fair market value that is determined by local assessors to be the total taxable value of land and additions on the property. | Land | Improvement |
|---|---|---|---|---|
| 2025 | $1,377 | $12,349 | -- | -- |
| 2024 | $1,298 | $11,761 | -- | -- |
| 2023 | $1,298 | $23,580 | $4,710 | $18,870 |
| 2022 | $1,252 | $17,920 | $3,580 | $14,340 |
| 2021 | $1,283 | $16,180 | $3,230 | $12,950 |
| 2020 | $1,249 | $14,910 | $2,980 | $11,930 |
| 2019 | $1,226 | $12,730 | $2,540 | $10,190 |
| 2018 | $1,191 | $11,860 | $2,370 | $9,490 |
| 2017 | $653 | $9,460 | $1,890 | $7,570 |
| 2016 | $642 | $8,580 | $1,710 | $6,870 |
| 2015 | $595 | $7,910 | $1,580 | $6,330 |
Source: Public Records
Map
Nearby Homes
- 3331 W Del Monico Ln
- 3501 W Diana Ave
- 8544 N 33rd Ave
- 3510 W Seldon Ln
- 3412 W Butler Dr
- 3160 W Ruth Ave
- 8451 N 34th Ave
- 3554 W Townley Ave
- 8428 N 33rd Dr
- 3639 W Lawrence Ln
- 8410 N 32nd Ave
- 8235 N 34th Dr Unit 160
- 3718 W Puget Ave
- 8213 N 33rd Ln
- 9222 N 35th Ave Unit 11
- 9222 N 35th Ave Unit 1
- 3636 W Echo Ln
- 3714 W Echo Ln
- 3701 W Echo Ln Unit 4
- 3812 W Barbara Ave
- 3431 W Alice Ave
- 3419 W Alice Ave
- 8617 N 34th Dr
- 3435 W Alice Ave
- 3413 W Alice Ave
- 8616 N 34th Dr
- 3423 W Tangerine Ln
- 3427 W Tangerine Ln
- 3425 W Tangerine Ln
- 3421 W Tangerine Ln
- 3429 W Tangerine Ln
- 3419 W Tangerine Ln
- 8611 N 34th Dr
- 3431 W Tangerine Ln
- 3417 W Tangerine Ln
- 3407 W Alice Ave
- 3433 W Tangerine Ln
- 3441 W Alice Ave
- 8623 N 35th Ave
- 8612 N 34th Dr