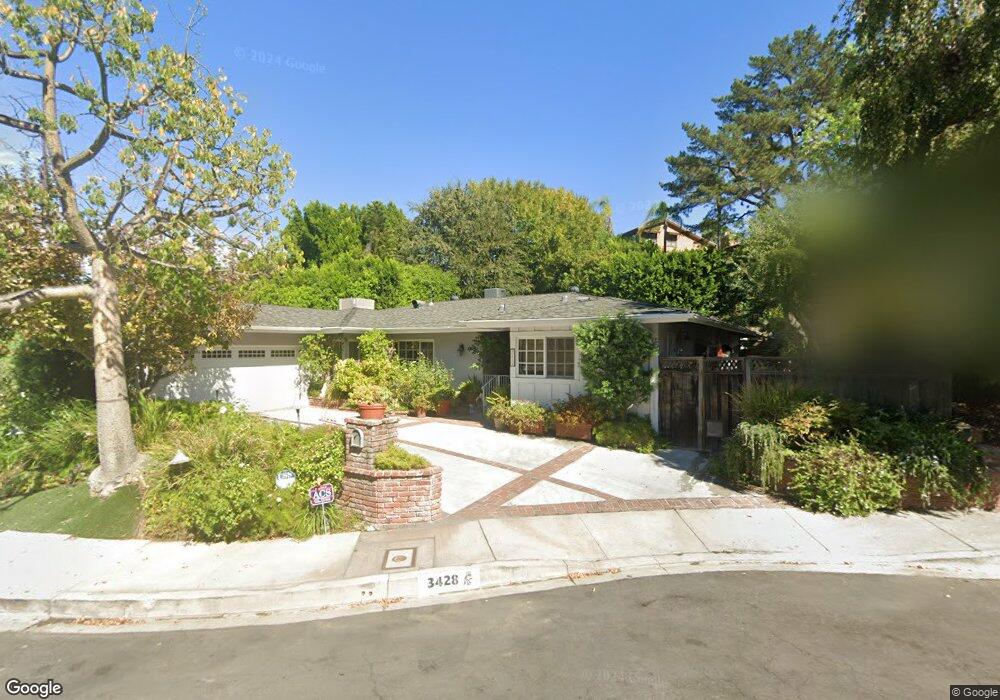
3428 Castlewoods Place Sherman Oaks, CA 91403
Estimated Value: $1,889,664 - $2,380,000
4
Beds
3
Baths
2,816
Sq Ft
$747/Sq Ft
Est. Value
About This Home
This home is located at 3428 Castlewoods Place, Sherman Oaks, CA 91403 and is currently estimated at $2,103,666, approximately $747 per square foot. 3428 Castlewoods Place is a home located in Los Angeles County with nearby schools including Van Nuys High School, Ivy Bound Academy of Math Sci and Tech Charter Middle, and Sherman Oaks Elementary Charter School.
Ownership History
Date
Name
Owned For
Owner Type
Purchase Details
Closed on
Jan 31, 2018
Sold by
Capo David J and Capo Georgia D
Bought by
Capo David J and Capo Georgia D
Current Estimated Value
Home Financials for this Owner
Home Financials are based on the most recent Mortgage that was taken out on this home.
Original Mortgage
$1,000,000
Interest Rate
3.75%
Mortgage Type
Adjustable Rate Mortgage/ARM
Purchase Details
Closed on
Apr 17, 2017
Sold by
Capo Bradley Howard and The David J Capo & Georgia D C
Bought by
Capo David J and Capo Georgia D
Purchase Details
Closed on
Feb 27, 2017
Sold by
Capo David and Capo Georgia
Bought by
Capo Bradley Howard and Capo David
Purchase Details
Closed on
Aug 20, 2006
Sold by
Capo David J and Capo Georgia D
Bought by
Capo David J and Capo Georgia D
Create a Home Valuation Report for This Property
The Home Valuation Report is an in-depth analysis detailing your home's value as well as a comparison with similar homes in the area
Home Values in the Area
Average Home Value in this Area
Purchase History
| Date | Buyer | Sale Price | Title Company |
|---|---|---|---|
| Capo David J | -- | First American Title Company | |
| Capo David J | -- | None Available | |
| Capo Bradley Howard | -- | None Available | |
| Capo David J | -- | None Available |
Source: Public Records
Mortgage History
| Date | Status | Borrower | Loan Amount |
|---|---|---|---|
| Closed | Capo David J | $1,000,000 |
Source: Public Records
Tax History Compared to Growth
Tax History
| Year | Tax Paid | Tax Assessment Tax Assessment Total Assessment is a certain percentage of the fair market value that is determined by local assessors to be the total taxable value of land and additions on the property. | Land | Improvement |
|---|---|---|---|---|
| 2025 | $3,368 | $246,481 | $80,391 | $166,090 |
| 2024 | $3,368 | $241,649 | $78,815 | $162,834 |
| 2023 | $3,310 | $236,912 | $77,270 | $159,642 |
| 2022 | $3,190 | $232,267 | $75,755 | $156,512 |
| 2021 | $3,137 | $227,714 | $74,270 | $153,444 |
| 2019 | $3,051 | $220,962 | $72,068 | $148,894 |
| 2018 | $2,936 | $216,630 | $70,655 | $145,975 |
| 2016 | $2,766 | $208,219 | $67,912 | $140,307 |
| 2015 | $2,729 | $205,092 | $66,892 | $138,200 |
| 2014 | $2,746 | $201,075 | $65,582 | $135,493 |
Source: Public Records
Map
Nearby Homes
- 3421 Castlewoods Place
- 15946 Tobin Way
- 3634 Royal Meadow Rd
- 3545 Alana Dr
- 15656 Crownridge Place
- 3690 Crownridge Dr
- 15508 Royal Ridge Rd
- 3535 Vista Haven Rd
- 3482 Vista Haven Rd
- 3847 Royal Woods Dr
- 16187 Royal Oak Rd
- 15401 Mulholland Dr
- 3935 Valley Meadow Rd
- 3721 Woodcliff Rd
- 15511 Woodcrest Dr
- 16401 Mulholland Dr
- 15541 Aqua Verde Dr
- 15415 Milldale Dr
- 15464 Duomo Via St
- 4009 Valley Meadow Rd
- 3422 Castlewoods Place
- 3440 Castlewoods Place
- 15758 Castlewoods Dr
- 15750 Castlewoods Dr
- 15750 Regal Woods Place
- 3431 Castlewoods Place
- 3437 Castlewoods Place
- 3450 Castlewoods Place
- 3427 Castlewoods Place
- 3445 Castlewoods Place
- 15740 Castlewoods Dr
- 15800 Castlewoods Dr
- 15758 Regal Woods Place
- 15789 Castlewoods Dr
- 3430 Alana Dr
- 3424 Alana Dr
- 15767 Castlewoods Dr
- 3416 Alana Dr
- 3408 Alana Dr
- 15810 Castlewoods Dr