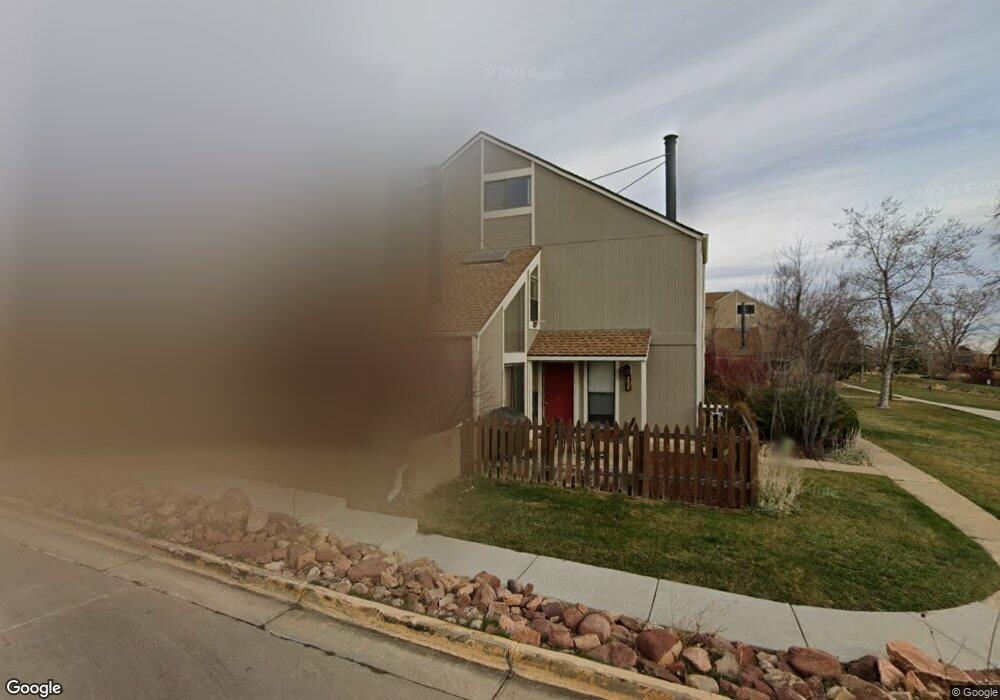
3428 Cripple Creek Square Unit E20 Boulder, CO 80305
Table Mesa NeighborhoodEstimated Value: $601,801 - $675,000
2
Beds
2
Baths
1,064
Sq Ft
$604/Sq Ft
Est. Value
About This Home
This home is located at 3428 Cripple Creek Square Unit E20, Boulder, CO 80305 and is currently estimated at $642,200, approximately $603 per square foot. 3428 Cripple Creek Square Unit E20 is a home located in Boulder County with nearby schools including Mesa Elementary School, Southern Hills Middle School, and Fairview High School.
Ownership History
Date
Name
Owned For
Owner Type
Purchase Details
Closed on
Mar 6, 2020
Sold by
Pappas Gregory
Bought by
Pappas Gregory C and Gregory C Pappas Living Trust
Current Estimated Value
Purchase Details
Closed on
Jun 13, 2018
Sold by
Larson Kristen Ann
Bought by
Pappas Gregory
Purchase Details
Closed on
May 28, 1998
Sold by
Lawrence Robert M and Lawrence Elaine
Bought by
Larson Kristen Ann
Home Financials for this Owner
Home Financials are based on the most recent Mortgage that was taken out on this home.
Original Mortgage
$141,500
Interest Rate
7.2%
Purchase Details
Closed on
Oct 24, 1983
Bought by
Larson Kristen Ann
Purchase Details
Closed on
Jun 13, 1983
Bought by
Larson Kristen Ann
Purchase Details
Closed on
Mar 5, 1980
Bought by
Larson Kristen Ann
Create a Home Valuation Report for This Property
The Home Valuation Report is an in-depth analysis detailing your home's value as well as a comparison with similar homes in the area
Home Values in the Area
Average Home Value in this Area
Purchase History
| Date | Buyer | Sale Price | Title Company |
|---|---|---|---|
| Pappas Gregory C | -- | None Available | |
| Pappas Gregory | $502,000 | Heritage Title Co | |
| Larson Kristen Ann | $153,000 | Heritage Title | |
| Larson Kristen Ann | $72,500 | -- | |
| Larson Kristen Ann | -- | -- | |
| Larson Kristen Ann | $63,400 | -- |
Source: Public Records
Mortgage History
| Date | Status | Borrower | Loan Amount |
|---|---|---|---|
| Previous Owner | Larson Kristen Ann | $141,500 |
Source: Public Records
Tax History
| Year | Tax Paid | Tax Assessment Tax Assessment Total Assessment is a certain percentage of the fair market value that is determined by local assessors to be the total taxable value of land and additions on the property. | Land | Improvement |
|---|---|---|---|---|
| 2025 | $3,334 | $40,200 | -- | $40,200 |
| 2024 | $3,334 | $40,200 | -- | $40,200 |
| 2023 | $3,273 | $37,033 | -- | $40,718 |
| 2022 | $3,452 | $36,362 | $0 | $36,362 |
| 2021 | $3,295 | $37,409 | $0 | $37,409 |
| 2020 | $3,048 | $35,021 | $0 | $35,021 |
| 2019 | $3,002 | $35,021 | $0 | $35,021 |
| 2018 | $3,006 | $34,668 | $0 | $34,668 |
| 2017 | $2,912 | $38,327 | $0 | $38,327 |
| 2016 | $2,243 | $25,910 | $0 | $25,910 |
| 2015 | $2,124 | $21,818 | $0 | $21,818 |
| 2014 | $1,834 | $21,818 | $0 | $21,818 |
Source: Public Records
Map
Nearby Homes
- 3394 Cripple Creek Trail Unit 15-H
- 3391 Cripple Creek Trail Unit E
- 3130 Kittrell Ct
- 3755 Silver Plume Ln
- 3970 Longwood Ave
- 1875 Lehigh St
- 2665 Juilliard St
- 2610 Iliff St
- 2596 Briarwood Dr
- 3590 Endicott Dr
- 4100 Greenbriar Blvd
- 3490 Emerson Ave
- 3210 Emerson Ave
- 4204 Greenbriar Blvd Unit 45
- 4286 Greenbriar Blvd
- 1220 Edinboro Dr
- 1270 Lehigh St
- 3210 Darley Ave
- 1596 Bradley Dr Unit 105C
- 2820 Colby Dr
- 3424 Cripple Creek Square Unit H20
- 3426 Cripple Creek Square Unit A20
- 3450 Cripple Creek Square Unit G19
- 3462 Cripple Creek Square Unit F19
- 3458 Cripple Creek Square Unit E19
- 3452 Cripple Creek Square Unit D19
- 3464 Cripple Creek Square Unit C19
- 3456 Cripple Creek Square Unit A19
- 3494 Cripple Creek Square Unit H18
- 3482 Cripple Creek Square Unit G18
- 3484 Cripple Creek Square Unit C18
- 3492 Cripple Creek Square Unit A18
- 3477 Cripple Creek Square Unit F17
- 3471 Cripple Creek Square Unit D17
- 3390 Cripple Creek Trail Unit E15
- 3384 Cripple Creek Trail Unit C15
- 3388 Cripple Creek Trail Unit B15
- 3395 Cripple Creek Trail Unit H14
- 3383 Cripple Creek Trail Unit G14
- 3385 Cripple Creek Trail Unit C14
Your Personal Tour Guide
Ask me questions while you tour the home.