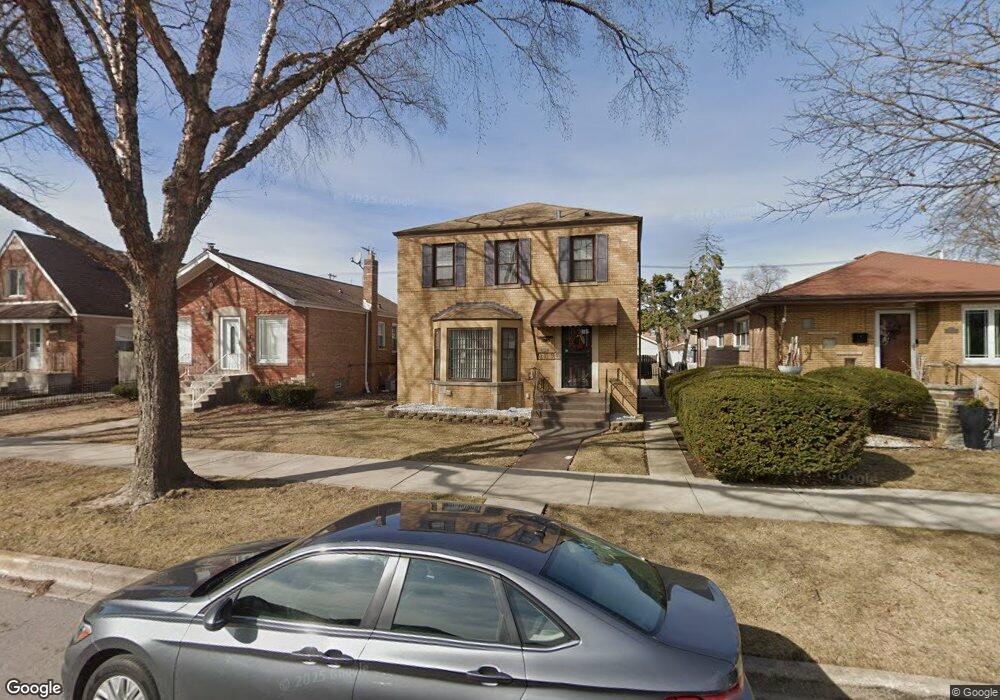
3428 W 84th St Chicago, IL 60652
Ashburn NeighborhoodEstimated Value: $254,000 - $325,000
4
Beds
2
Baths
1,324
Sq Ft
$218/Sq Ft
Est. Value
About This Home
This home is located at 3428 W 84th St, Chicago, IL 60652 and is currently estimated at $288,443, approximately $217 per square foot. 3428 W 84th St is a home located in Cook County with nearby schools including Carroll-Rosenwald Elementary School - Carroll Campus, Bogan Computer Technical High School, and CICS - Wrightwood.
Ownership History
Date
Name
Owned For
Owner Type
Purchase Details
Closed on
Oct 8, 2002
Sold by
Johnson Allen R
Bought by
Johnson Allen R and Johnson Linda C
Current Estimated Value
Home Financials for this Owner
Home Financials are based on the most recent Mortgage that was taken out on this home.
Original Mortgage
$129,000
Outstanding Balance
$16,641
Interest Rate
6.01%
Estimated Equity
$271,802
Purchase Details
Closed on
Apr 24, 1998
Sold by
Bernardino Nicolas
Bought by
Johnson Allen R
Home Financials for this Owner
Home Financials are based on the most recent Mortgage that was taken out on this home.
Original Mortgage
$117,255
Interest Rate
7.18%
Mortgage Type
FHA
Purchase Details
Closed on
Jan 2, 1997
Sold by
Tyler Steven C and Tyler Theresa A
Bought by
Bernardino Nicholas
Home Financials for this Owner
Home Financials are based on the most recent Mortgage that was taken out on this home.
Original Mortgage
$109,637
Interest Rate
7.93%
Mortgage Type
FHA
Create a Home Valuation Report for This Property
The Home Valuation Report is an in-depth analysis detailing your home's value as well as a comparison with similar homes in the area
Home Values in the Area
Average Home Value in this Area
Purchase History
| Date | Buyer | Sale Price | Title Company |
|---|---|---|---|
| Johnson Allen R | -- | -- | |
| Johnson Allen R | $117,500 | Chicago Title Insurance Co | |
| Bernardino Nicholas | $110,000 | Attorneys Natl Title Network |
Source: Public Records
Mortgage History
| Date | Status | Borrower | Loan Amount |
|---|---|---|---|
| Open | Johnson Allen R | $129,000 | |
| Closed | Johnson Allen R | $117,255 | |
| Previous Owner | Bernardino Nicholas | $109,637 |
Source: Public Records
Tax History Compared to Growth
Tax History
| Year | Tax Paid | Tax Assessment Tax Assessment Total Assessment is a certain percentage of the fair market value that is determined by local assessors to be the total taxable value of land and additions on the property. | Land | Improvement |
|---|---|---|---|---|
| 2024 | $3,121 | $19,000 | $2,835 | $16,165 |
| 2023 | $3,022 | $18,000 | $3,780 | $14,220 |
| 2022 | $3,022 | $18,000 | $3,780 | $14,220 |
| 2021 | $2,973 | $18,000 | $3,780 | $14,220 |
| 2020 | $2,854 | $15,802 | $3,780 | $12,022 |
| 2019 | $2,863 | $17,558 | $3,780 | $13,778 |
| 2018 | $2,814 | $17,558 | $3,780 | $13,778 |
| 2017 | $1,992 | $12,542 | $3,307 | $9,235 |
| 2016 | $2,030 | $12,542 | $3,307 | $9,235 |
| 2015 | $1,835 | $12,542 | $3,307 | $9,235 |
| 2014 | $1,760 | $11,958 | $3,071 | $8,887 |
| 2013 | $1,714 | $11,958 | $3,071 | $8,887 |
Source: Public Records
Map
Nearby Homes
- 3442 W 84th St
- 3237 W 83rd Place
- 8223 S Sawyer Ave
- 8118 S Spaulding Ave
- 3644 W 82nd St
- 8105 S Sawyer Ave
- 3614 W 86th Place
- 3720 W 82nd St
- 8242 S Albany Ave
- 3530 W 80th Place
- 3630 W 86th Place
- 8230 S Albany Ave
- 3617 W 80th Place
- 3631 W 80th Place
- 3101 W 87th St
- 3631 W 86th Place
- 3756 W 85th Place
- 8053 S Kedzie Ave
- 3826 W 83rd St
- 8033 S Kedzie Ave
- 3424 W 84th St
- 3424 W 84th St
- 3432 W 84th St
- 3436 W 84th St
- 3420 W 84th St
- 3418 W 84th St
- 3438 W 84th St
- 3427 W 83rd Place
- 3431 W 83rd Place
- 3435 W 83rd Place
- 3435 W 83rd Place
- 3414 W 84th St
- 3414 W 84th St
- 3423 W 83rd Place
- 3421 W 83rd Place
- 3439 W 83rd Place
- 3412 W 84th St
- 3417 W 83rd Place
- 3431 W 84th St
- 3427 W 84th St