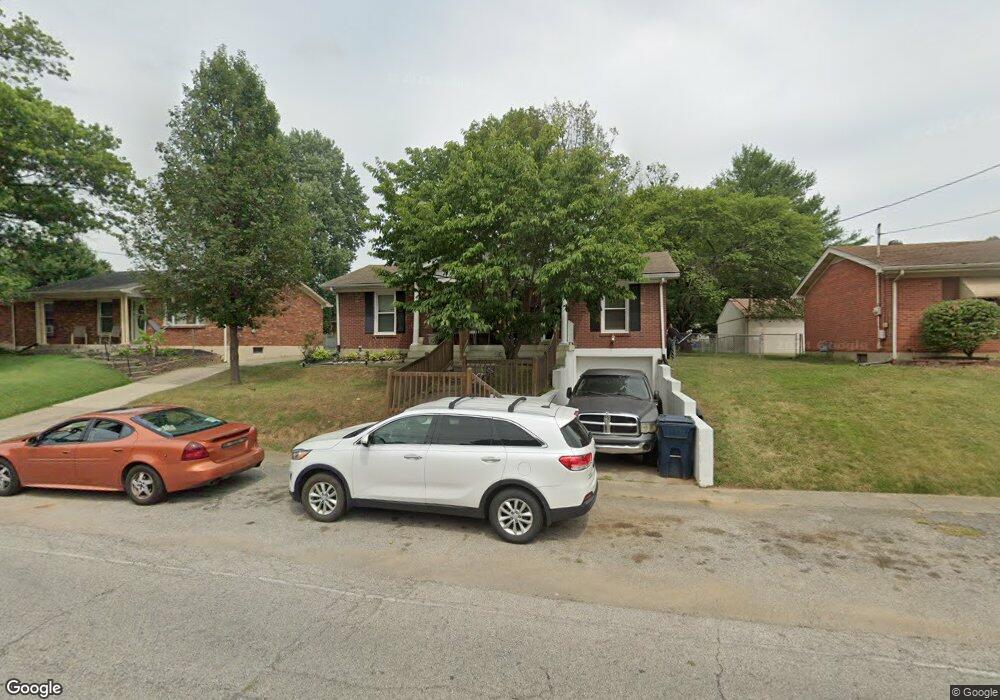
3429 Fern Lea Rd Louisville, KY 40216
Estimated Value: $214,000 - $254,000
3
Beds
2
Baths
1,075
Sq Ft
$215/Sq Ft
Est. Value
About This Home
This home is located at 3429 Fern Lea Rd, Louisville, KY 40216 and is currently estimated at $230,860, approximately $214 per square foot. 3429 Fern Lea Rd is a home located in Jefferson County with nearby schools including Cane Run Elementary School, Mill Creek Elementary School, and Jacob Elementary School.
Ownership History
Date
Name
Owned For
Owner Type
Purchase Details
Closed on
Dec 30, 2014
Sold by
Cox Harlon W and Queen Melissa
Bought by
Webb Steven D
Current Estimated Value
Purchase Details
Closed on
Jan 28, 2011
Sold by
White Ed L
Bought by
Cox Harlon W and Queen Melissa
Home Financials for this Owner
Home Financials are based on the most recent Mortgage that was taken out on this home.
Original Mortgage
$53,000
Interest Rate
4.18%
Mortgage Type
Purchase Money Mortgage
Purchase Details
Closed on
Dec 20, 2010
Sold by
M & I Bank Fsb
Bought by
White Ed L
Home Financials for this Owner
Home Financials are based on the most recent Mortgage that was taken out on this home.
Original Mortgage
$53,000
Interest Rate
4.18%
Mortgage Type
Purchase Money Mortgage
Purchase Details
Closed on
May 18, 2010
Sold by
Bridwell Debbie and Bridwell Thomas
Bought by
M & I Bank Fsb
Create a Home Valuation Report for This Property
The Home Valuation Report is an in-depth analysis detailing your home's value as well as a comparison with similar homes in the area
Home Values in the Area
Average Home Value in this Area
Purchase History
| Date | Buyer | Sale Price | Title Company |
|---|---|---|---|
| Webb Steven D | $50,000 | Regional First Title Group | |
| Cox Harlon W | $63,900 | None Available | |
| White Ed L | $50,000 | Prism Title & Closing Servic | |
| M & I Bank Fsb | $74,000 | None Available |
Source: Public Records
Mortgage History
| Date | Status | Borrower | Loan Amount |
|---|---|---|---|
| Previous Owner | White Ed L | $53,000 |
Source: Public Records
Tax History Compared to Growth
Tax History
| Year | Tax Paid | Tax Assessment Tax Assessment Total Assessment is a certain percentage of the fair market value that is determined by local assessors to be the total taxable value of land and additions on the property. | Land | Improvement |
|---|---|---|---|---|
| 2024 | $1,359 | $140,790 | $12,000 | $128,790 |
| 2023 | $1,405 | $140,790 | $12,000 | $128,790 |
| 2022 | $1,083 | $108,120 | $15,000 | $93,120 |
| 2021 | $1,184 | $108,120 | $15,000 | $93,120 |
| 2020 | $1,089 | $108,120 | $15,000 | $93,120 |
| 2019 | $1,064 | $108,120 | $15,000 | $93,120 |
| 2018 | $305 | $89,970 | $20,000 | $69,970 |
| 2017 | $854 | $89,970 | $20,000 | $69,970 |
| 2013 | $639 | $63,900 | $22,000 | $41,900 |
Source: Public Records
Map
Nearby Homes
- 2220 Mary Catherine Dr
- 2222 Farnsley Rd
- 2109 Crums Ln
- 2228 Amboy Dr
- 1854 Farnsley Rd
- 3309 Fern Lea Rd
- 2129 East Ln
- 4105 North Ln
- 2301 Farnsley Rd
- 2231 Peaslee Rd
- 1908 Crums Ln
- 2219 Perth Ct
- 1818 Mary Catherine Dr
- 4130 Hillview Ave
- 1843 Olenda Ave
- 4036 Valley View Dr
- 3805 Dixie Hwy
- 1932 Garrs Ln
- 4006 Addison Ln
- 4143 Hillview Ave
- 3431 Fern Lea Rd
- 3427 Fern Lea Rd
- 4 Bella Ct
- 3 Bella Ct
- 3425 Fern Lea Rd
- 4 Bella Ct
- 2013 Foxhurst Dr
- 3433 Fern Lea Rd
- 3 Bella Ct
- 2011 Foxhurst Dr
- 3424 Fern Lea Rd
- 3426 Fern Lea Rd
- 3423 Fern Lea Rd
- 3422 Fern Lea Rd
- 5 Bella Ct
- 3428 Fern Lea Rd
- 2009 Foxhurst Dr
- 2 Bella Ct
- 3420 Fern Lea Rd
- 3430 Fern Lea Rd