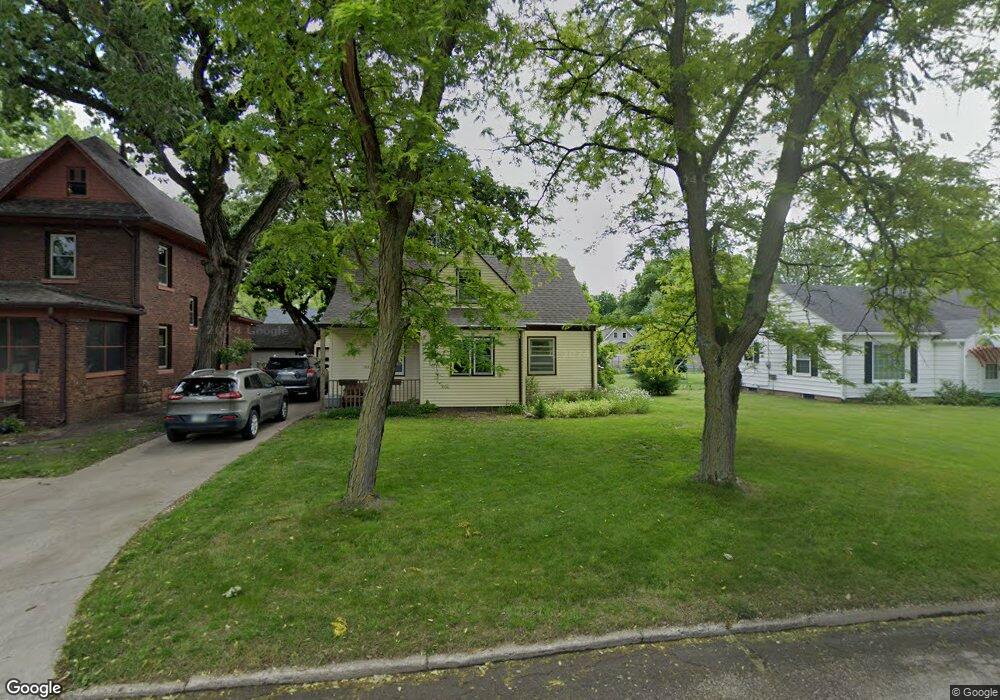
343 11th Ave N Fort Dodge, IA 50501
Estimated Value: $143,451 - $155,000
4
Beds
2
Baths
1,165
Sq Ft
$128/Sq Ft
Est. Value
About This Home
This home is located at 343 11th Ave N, Fort Dodge, IA 50501 and is currently estimated at $149,363, approximately $128 per square foot. 343 11th Ave N is a home located in Webster County with nearby schools including Feelhaver Elementary School, Fort Dodge Middle School, and Fort Dodge Senior High School.
Ownership History
Date
Name
Owned For
Owner Type
Purchase Details
Closed on
Jun 2, 2021
Sold by
Simpson Pamela K
Bought by
Earnest Tristan L and Astor Katherine J
Current Estimated Value
Home Financials for this Owner
Home Financials are based on the most recent Mortgage that was taken out on this home.
Original Mortgage
$117,000
Outstanding Balance
$105,929
Interest Rate
2.9%
Mortgage Type
New Conventional
Estimated Equity
$43,434
Purchase Details
Closed on
Aug 12, 2005
Sold by
Baker Janis A
Bought by
Simpson Pamela K
Create a Home Valuation Report for This Property
The Home Valuation Report is an in-depth analysis detailing your home's value as well as a comparison with similar homes in the area
Home Values in the Area
Average Home Value in this Area
Purchase History
| Date | Buyer | Sale Price | Title Company |
|---|---|---|---|
| Earnest Tristan L | $130,500 | None Available | |
| Simpson Pamela K | $56,000 | None Available |
Source: Public Records
Mortgage History
| Date | Status | Borrower | Loan Amount |
|---|---|---|---|
| Open | Earnest Tristan L | $117,000 |
Source: Public Records
Tax History Compared to Growth
Tax History
| Year | Tax Paid | Tax Assessment Tax Assessment Total Assessment is a certain percentage of the fair market value that is determined by local assessors to be the total taxable value of land and additions on the property. | Land | Improvement |
|---|---|---|---|---|
| 2025 | $2,154 | $115,970 | $9,900 | $106,070 |
| 2024 | $2,154 | $109,980 | $9,900 | $100,080 |
| 2023 | $2,256 | $109,980 | $9,900 | $100,080 |
| 2022 | $2,184 | $101,130 | $9,900 | $91,230 |
| 2021 | $2,180 | $101,130 | $9,900 | $91,230 |
| 2020 | $2,180 | $96,020 | $9,900 | $86,120 |
| 2019 | $1,234 | $66,300 | $11,980 | $54,320 |
| 2018 | $930 | $57,180 | $10,890 | $46,290 |
| 2017 | $930 | $59,150 | $0 | $0 |
| 2016 | $1,266 | $59,150 | $0 | $0 |
| 2015 | $1,266 | $59,150 | $0 | $0 |
| 2014 | $1,240 | $59,150 | $0 | $0 |
Source: Public Records
Map
Nearby Homes