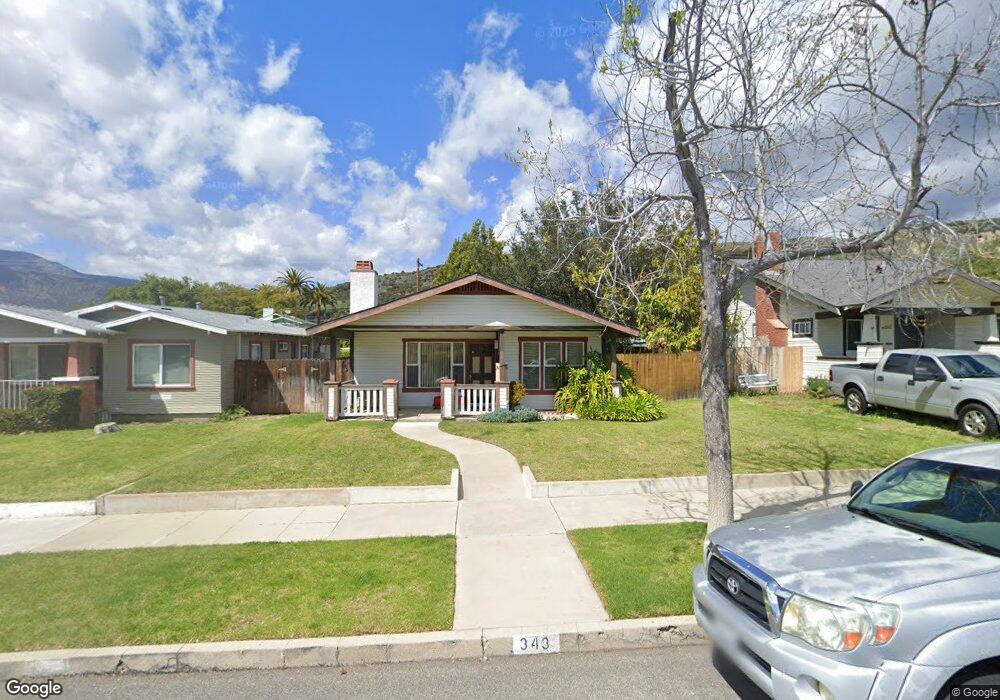
343 3rd St Fillmore, CA 93015
Estimated Value: $662,000 - $722,000
3
Beds
2
Baths
1,434
Sq Ft
$485/Sq Ft
Est. Value
About This Home
This home is located at 343 3rd St, Fillmore, CA 93015 and is currently estimated at $695,180, approximately $484 per square foot. 343 3rd St is a home located in Ventura County with nearby schools including Fillmore Senior High.
Ownership History
Date
Name
Owned For
Owner Type
Purchase Details
Closed on
Mar 25, 1999
Sold by
Flores Henry and Flores Lourdes
Bought by
Bauer Wayne L
Current Estimated Value
Home Financials for this Owner
Home Financials are based on the most recent Mortgage that was taken out on this home.
Original Mortgage
$186,463
Outstanding Balance
$46,015
Interest Rate
6.98%
Mortgage Type
FHA
Estimated Equity
$649,165
Purchase Details
Closed on
Mar 18, 1996
Sold by
Chavez Sara and Santiago Abdi
Bought by
Flores Henry and Flores Lourdes
Purchase Details
Closed on
Nov 15, 1995
Sold by
Scoles John F and Scoles Mary E
Bought by
Chavez Sara and Santiago Abdi
Home Financials for this Owner
Home Financials are based on the most recent Mortgage that was taken out on this home.
Original Mortgage
$151,767
Interest Rate
7.36%
Mortgage Type
FHA
Create a Home Valuation Report for This Property
The Home Valuation Report is an in-depth analysis detailing your home's value as well as a comparison with similar homes in the area
Home Values in the Area
Average Home Value in this Area
Purchase History
| Date | Buyer | Sale Price | Title Company |
|---|---|---|---|
| Bauer Wayne L | $188,000 | Lawyers Title Company | |
| Flores Henry | -- | -- | |
| Chavez Sara | $154,500 | Chicago Title Co |
Source: Public Records
Mortgage History
| Date | Status | Borrower | Loan Amount |
|---|---|---|---|
| Open | Bauer Wayne L | $186,463 | |
| Previous Owner | Chavez Sara | $151,767 |
Source: Public Records
Tax History Compared to Growth
Tax History
| Year | Tax Paid | Tax Assessment Tax Assessment Total Assessment is a certain percentage of the fair market value that is determined by local assessors to be the total taxable value of land and additions on the property. | Land | Improvement |
|---|---|---|---|---|
| 2025 | $3,209 | $294,698 | $125,402 | $169,296 |
| 2024 | $3,209 | $288,920 | $122,943 | $165,977 |
| 2023 | $3,165 | $283,255 | $120,532 | $162,723 |
| 2022 | $2,925 | $277,701 | $118,168 | $159,533 |
| 2021 | $3,323 | $272,256 | $115,851 | $156,405 |
| 2020 | $3,082 | $269,466 | $114,664 | $154,802 |
| 2019 | $3,090 | $264,183 | $112,416 | $151,767 |
| 2018 | $3,027 | $259,004 | $110,212 | $148,792 |
| 2017 | $3,043 | $253,926 | $108,051 | $145,875 |
| 2016 | $2,817 | $248,948 | $105,933 | $143,015 |
| 2015 | $2,737 | $245,211 | $104,343 | $140,868 |
| 2014 | $2,734 | $240,409 | $102,300 | $138,109 |
Source: Public Records
Map
Nearby Homes
- 412 Blaine Ave
- 638 Clay St
- 0 Fillmore St
- 340 Central Ave
- 229 Main St
- 770 Edison Ln
- 803 Sespe Ave
- 621 Lemon Way
- 196 Elmwood St
- 199 Rosewood St
- 939 Meadowlark Dr
- 185 Rosewood St
- 81 Wildwood Ln
- 89 Willow St
- 396 Edgewood Dr
- 569 Grapefruit Ln
- 74 Teakwood St
- 513 Heritage Valley Pkwy
- 309 Heritage Valley Pkwy
- 1028 Meadowlark Dr