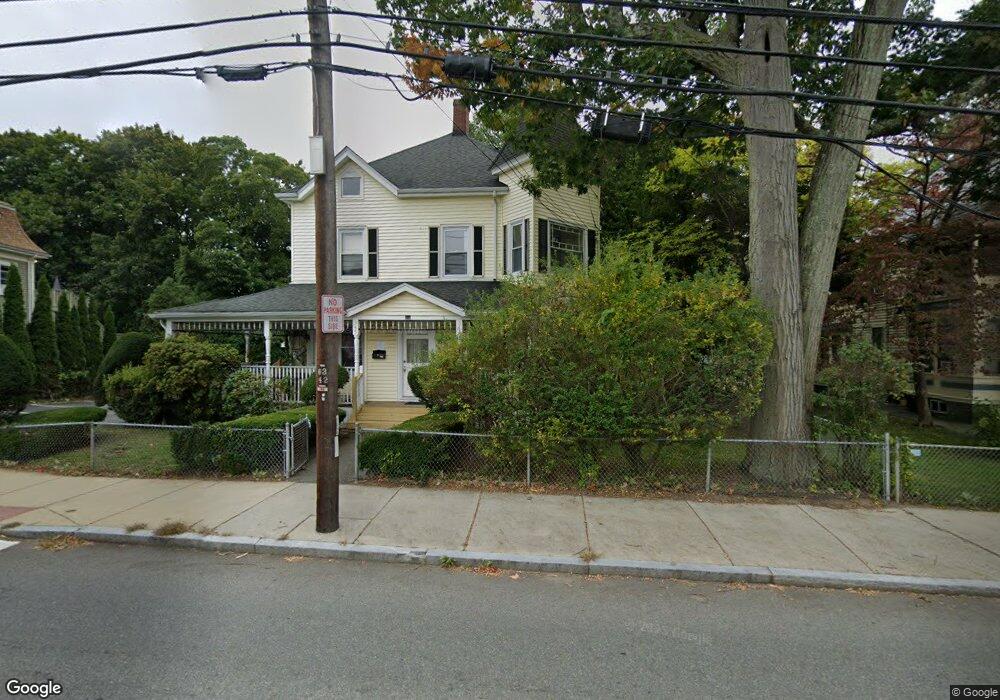
343 Crescent St Waltham, MA 02453
South Side NeighborhoodEstimated Value: $1,084,000 - $1,238,000
6
Beds
3
Baths
2,688
Sq Ft
$424/Sq Ft
Est. Value
About This Home
This home is located at 343 Crescent St, Waltham, MA 02453 and is currently estimated at $1,140,192, approximately $424 per square foot. 343 Crescent St is a home located in Middlesex County with nearby schools including Henry Whittemore Elementary School, John W. Mcdevitt Middle School, and Waltham Sr High School.
Ownership History
Date
Name
Owned For
Owner Type
Purchase Details
Closed on
Aug 4, 2011
Sold by
Antonetta Cardillo Lt
Bought by
Feng Yao
Current Estimated Value
Home Financials for this Owner
Home Financials are based on the most recent Mortgage that was taken out on this home.
Original Mortgage
$422,685
Outstanding Balance
$291,842
Interest Rate
4.51%
Mortgage Type
Purchase Money Mortgage
Estimated Equity
$848,350
Purchase Details
Closed on
Oct 11, 2006
Sold by
Cardillo Antonetta
Bought by
Antonetta Cardillo Lt
Create a Home Valuation Report for This Property
The Home Valuation Report is an in-depth analysis detailing your home's value as well as a comparison with similar homes in the area
Home Values in the Area
Average Home Value in this Area
Purchase History
| Date | Buyer | Sale Price | Title Company |
|---|---|---|---|
| Feng Yao | $465,000 | -- | |
| Antonetta Cardillo Lt | -- | -- |
Source: Public Records
Mortgage History
| Date | Status | Borrower | Loan Amount |
|---|---|---|---|
| Open | Feng Yao | $422,685 |
Source: Public Records
Tax History Compared to Growth
Tax History
| Year | Tax Paid | Tax Assessment Tax Assessment Total Assessment is a certain percentage of the fair market value that is determined by local assessors to be the total taxable value of land and additions on the property. | Land | Improvement |
|---|---|---|---|---|
| 2025 | $9,503 | $967,700 | $416,200 | $551,500 |
| 2024 | $8,796 | $912,400 | $416,200 | $496,200 |
| 2023 | $8,826 | $855,200 | $379,100 | $476,100 |
| 2022 | $8,942 | $802,700 | $346,200 | $456,500 |
| 2021 | $8,385 | $740,700 | $313,200 | $427,500 |
| 2020 | $8,303 | $694,800 | $296,700 | $398,100 |
| 2019 | $7,840 | $619,300 | $293,800 | $325,500 |
| 2018 | $7,089 | $562,200 | $272,000 | $290,200 |
| 2017 | $6,751 | $537,500 | $247,300 | $290,200 |
| 2016 | $6,225 | $508,600 | $218,400 | $290,200 |
| 2015 | $5,979 | $455,400 | $214,300 | $241,100 |
Source: Public Records
Map
Nearby Homes
- 73 Orange St Unit 2
- 11 Derby St
- 31-37 Washington Ave
- 15 Alder St Unit 1
- 101-103 Lexington St
- 24 Tolman St Unit A
- 47 Alder St Unit 6
- 40 Myrtle St Unit 9
- 42 Alder St
- 81 Alder St
- 265-267 River St Unit 267
- 265-267 River St Unit 265
- 61 Hall St Unit 1
- 61 Hall St Unit 9
- 61 Hall St Unit 2
- 61 Hall St Unit 7
- 85 Crescent St
- 138 Myrtle St Unit 2
- 312 Newton St Unit 1A
- 55-57 Crescent St
- 345 Crescent St Unit 2
- 345 Crescent St
- 343 Crescent St Unit 1
- 337 Crescent St
- 349 Crescent St
- 349 Crescent St Unit 2
- 329 Crescent St Unit 4
- 329 Crescent St Unit 3
- 329 Crescent St Unit 2
- 329 Crescent St Unit 1
- 329 Crescent St Unit U
- 334 Crescent St
- 225 Adams St
- 353 Crescent St
- 342 Crescent St Unit 342-1
- 342 Crescent St Unit 2
- 5 Chester Ave Unit 1
- 5 Chester Ave
- 5 Chester Ave Unit 2
- 326 Crescent St Unit 328