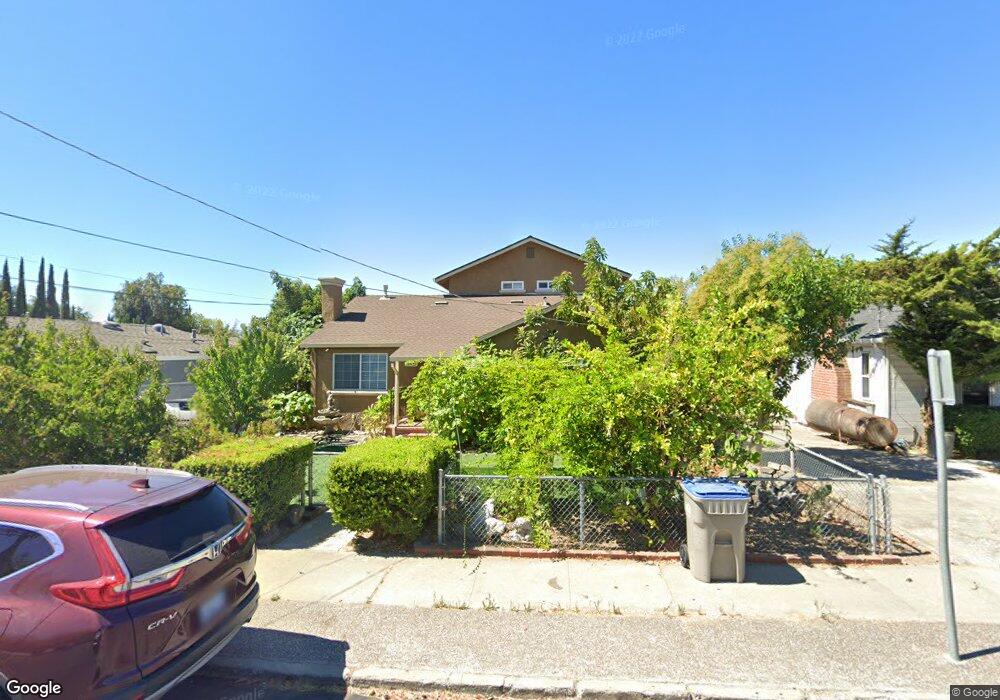
343 Doris Ave San Jose, CA 95127
Alum Rock NeighborhoodEstimated Value: $1,157,000 - $1,238,000
4
Beds
2
Baths
2,464
Sq Ft
$484/Sq Ft
Est. Value
About This Home
This home is located at 343 Doris Ave, San Jose, CA 95127 and is currently estimated at $1,193,553, approximately $484 per square foot. 343 Doris Ave is a home located in Santa Clara County with nearby schools including Lyndale Elementary School, William Sheppard Middle School, and James Lick High School.
Ownership History
Date
Name
Owned For
Owner Type
Purchase Details
Closed on
Oct 30, 2020
Sold by
Valdovinos Jose Luis and Valdovinos Rocio
Bought by
Valdovinos Jose Luis and Valdovinos Rocio
Current Estimated Value
Purchase Details
Closed on
Sep 23, 1999
Sold by
Louie Szi
Bought by
Valdovinos Luis and Valdovinos Rocio
Home Financials for this Owner
Home Financials are based on the most recent Mortgage that was taken out on this home.
Original Mortgage
$288,000
Outstanding Balance
$88,990
Interest Rate
8.37%
Estimated Equity
$1,104,563
Create a Home Valuation Report for This Property
The Home Valuation Report is an in-depth analysis detailing your home's value as well as a comparison with similar homes in the area
Home Values in the Area
Average Home Value in this Area
Purchase History
| Date | Buyer | Sale Price | Title Company |
|---|---|---|---|
| Valdovinos Jose Luis | -- | None Available | |
| Valdovinos Luis | $360,000 | Fidelity National Title Co |
Source: Public Records
Mortgage History
| Date | Status | Borrower | Loan Amount |
|---|---|---|---|
| Open | Valdovinos Luis | $288,000 | |
| Closed | Valdovinos Luis | $36,000 |
Source: Public Records
Tax History
| Year | Tax Paid | Tax Assessment Tax Assessment Total Assessment is a certain percentage of the fair market value that is determined by local assessors to be the total taxable value of land and additions on the property. | Land | Improvement |
|---|---|---|---|---|
| 2025 | $9,260 | $553,291 | $199,796 | $353,495 |
| 2024 | $9,260 | $542,443 | $195,879 | $346,564 |
| 2023 | $9,058 | $531,808 | $192,039 | $339,769 |
| 2022 | $8,872 | $521,381 | $188,274 | $333,107 |
| 2021 | $8,539 | $511,159 | $184,583 | $326,576 |
| 2020 | $8,299 | $505,919 | $182,691 | $323,228 |
| 2019 | $8,043 | $496,000 | $179,109 | $316,891 |
| 2018 | $7,920 | $486,276 | $175,598 | $310,678 |
| 2017 | $7,931 | $476,742 | $172,155 | $304,587 |
| 2016 | $7,108 | $467,395 | $168,780 | $298,615 |
| 2015 | $7,146 | $460,375 | $166,245 | $294,130 |
| 2014 | $6,586 | $451,358 | $162,989 | $288,369 |
Source: Public Records
Map
Nearby Homes
- 314 Lyndale Ave
- 13627 Marmont Way
- 520 S Capitol Ave
- 13861 Highwood Dr
- 10311 Dover Way
- 104 Rose Ln
- 3116 Florence Ct
- 2410 Dobern Ave
- 42 Muirfield Ct Unit 10
- 3391 E Hills Dr
- 10121 Torrance Ave
- 00 Harriet Ave
- 130 Monte Verano Ct
- 0 Harriet Ave
- 1159 Lancelot Ln
- 75 Marian Ln
- 10230 Griffith St
- 10170 Meadow Ln
- 312 Mullion Ct
- 2138 E San Antonio St
Your Personal Tour Guide
Ask me questions while you tour the home.