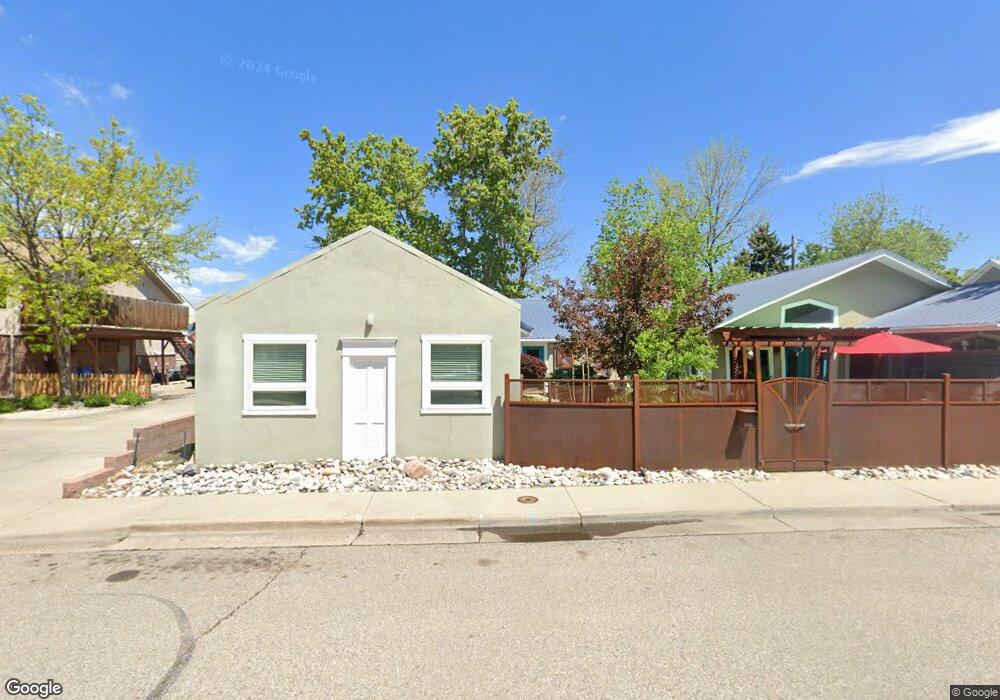
343 E 2nd St Loveland, CO 80537
Estimated Value: $477,000 - $628,000
2
Beds
2
Baths
2,025
Sq Ft
$270/Sq Ft
Est. Value
About This Home
This home is located at 343 E 2nd St, Loveland, CO 80537 and is currently estimated at $546,241, approximately $269 per square foot. 343 E 2nd St is a home located in Larimer County with nearby schools including Truscott Elementary School, Bill Reed Middle School, and Loveland High School.
Ownership History
Date
Name
Owned For
Owner Type
Purchase Details
Closed on
Jul 30, 2020
Sold by
Russell Vicky Ann and Russell Vicky A
Bought by
Vicky Ann Russell Trust
Current Estimated Value
Purchase Details
Closed on
Apr 24, 2001
Sold by
Unger Vicky A and Molgard Vicky Ann
Bought by
Russell Vicky A
Home Financials for this Owner
Home Financials are based on the most recent Mortgage that was taken out on this home.
Original Mortgage
$88,627
Interest Rate
9.5%
Purchase Details
Closed on
Oct 28, 1998
Sold by
Unger Vicky A
Bought by
Molgard Vicky A
Purchase Details
Closed on
Jan 2, 1997
Sold by
Molgard Vicky Ann and Unger Vicky Ann
Bought by
Molgard Vicky Ann
Purchase Details
Closed on
Jul 14, 1992
Sold by
Affiliated Nat'L Bank Lov
Bought by
Unger Vicky A
Purchase Details
Closed on
Jul 1, 1992
Sold by
Mayea John F W
Bought by
Affiliated National Bank-Lov
Create a Home Valuation Report for This Property
The Home Valuation Report is an in-depth analysis detailing your home's value as well as a comparison with similar homes in the area
Home Values in the Area
Average Home Value in this Area
Purchase History
| Date | Buyer | Sale Price | Title Company |
|---|---|---|---|
| Vicky Ann Russell Trust | -- | None Listed On Document | |
| Russell Vicky A | -- | -- | |
| Molgard Vicky A | -- | -- | |
| Molgard Vicky Ann | -- | -- | |
| Unger Vicky A | $75,000 | -- | |
| Affiliated National Bank-Lov | -- | -- |
Source: Public Records
Mortgage History
| Date | Status | Borrower | Loan Amount |
|---|---|---|---|
| Previous Owner | Russell Vicky A | $88,627 |
Source: Public Records
Tax History Compared to Growth
Tax History
| Year | Tax Paid | Tax Assessment Tax Assessment Total Assessment is a certain percentage of the fair market value that is determined by local assessors to be the total taxable value of land and additions on the property. | Land | Improvement |
|---|---|---|---|---|
| 2025 | $1,866 | $33,769 | $2,379 | $31,390 |
| 2024 | $1,800 | $33,769 | $2,379 | $31,390 |
| 2022 | $1,623 | $27,348 | $2,467 | $24,881 |
| 2021 | $1,668 | $28,135 | $2,538 | $25,597 |
| 2020 | $2,193 | $34,727 | $2,538 | $32,189 |
| 2019 | $2,156 | $34,727 | $2,538 | $32,189 |
| 2018 | $1,553 | $26,064 | $2,556 | $23,508 |
| 2017 | $1,337 | $26,064 | $2,556 | $23,508 |
| 2016 | $1,091 | $22,837 | $2,826 | $20,011 |
| 2015 | $1,082 | $28,990 | $2,830 | $26,160 |
| 2014 | $1,466 | $19,500 | $2,910 | $16,590 |
Source: Public Records
Map
Nearby Homes
- 203 N Jefferson Ave
- 108 S Jefferson Ave
- 108 S Cleveland Ave
- 199 S Jefferson Ave Unit 205
- 143 W 2nd St
- 535 N Adams Ave
- 205 E 6th St Unit 400
- 205 E 6th St Unit 302
- 205 E 6th St Unit 200
- 205 E 6th St Unit 205
- 205 E 6th St Unit 301
- 205 E 6th St Unit 305
- 205 E 6th St Unit 300
- 205 E 6th St Unit 204
- 205 E 6th St Unit 303
- 205 E 6th St Unit 202
- 205 E 6th St Unit 304
- 1064 E 1st St
- 770 N Lincoln Ave
- 707 E 8th St
- 211 N Jefferson Ave
- 217 N Jefferson Ave Unit 12
- 217 N Jefferson Ave
- 332 E 2nd St
- 324 E 2nd St
- 346 E 2nd St
- 120 N Lincoln Ave
- 320 E 3rd St
- 342 E 3rd St
- 404 E 2nd St
- 204 N Jefferson Ave
- 101 N Jefferson Ave
- 208 N Jefferson Ave
- 408 E 2nd St
- 220 N Jefferson Ave
- 201 N Lincoln Ave
- 401 E 1st St
- 404 E 3rd St
- 418 E 2nd St
- 123 N Lincoln Ave