Kips Bay Towers 343 E 30th St Unit 21M New York, NY 10016
Kips Bay NeighborhoodEstimated Value: $1,265,000 - $1,556,000
--
Bed
--
Bath
1,228
Sq Ft
$1,171/Sq Ft
Est. Value
About This Home
This home is located at 343 E 30th St Unit 21M, New York, NY 10016 and is currently estimated at $1,438,205, approximately $1,171 per square foot. 343 E 30th St Unit 21M is a home located in New York County with nearby schools including River School (The), Simon Baruch Middle School 104, and Clinton School.
Ownership History
Date
Name
Owned For
Owner Type
Purchase Details
Closed on
Mar 30, 2025
Sold by
Cau George A and George A Cau 2002 Revocable Trust
Bought by
George A Cau 1987 Children'S Trust and Giff
Current Estimated Value
Purchase Details
Closed on
Mar 21, 2005
Sold by
Marcella Renee
Bought by
Cau 2002 R5evocable Trust George A and Cau As Trustee George A
Purchase Details
Closed on
Sep 17, 2003
Sold by
Ransohoff Rita
Bought by
Marcella Renee and Marcella Zeno
Home Financials for this Owner
Home Financials are based on the most recent Mortgage that was taken out on this home.
Original Mortgage
$650,000
Interest Rate
6.43%
Mortgage Type
Purchase Money Mortgage
Create a Home Valuation Report for This Property
The Home Valuation Report is an in-depth analysis detailing your home's value as well as a comparison with similar homes in the area
Home Values in the Area
Average Home Value in this Area
Purchase History
| Date | Buyer | Sale Price | Title Company |
|---|---|---|---|
| George A Cau 1987 Children'S Trust | -- | -- | |
| Cau 2002 R5evocable Trust George A | -- | -- | |
| Cau 2002 R5evocable Trust George A | -- | -- | |
| Marcella Renee | $950,000 | -- | |
| Marcella Renee | $950,000 | -- |
Source: Public Records
Mortgage History
| Date | Status | Borrower | Loan Amount |
|---|---|---|---|
| Previous Owner | Marcella Renee | $650,000 | |
| Closed | Cau 2002 R5evocable Trust George A | $0 |
Source: Public Records
Tax History Compared to Growth
Tax History
| Year | Tax Paid | Tax Assessment Tax Assessment Total Assessment is a certain percentage of the fair market value that is determined by local assessors to be the total taxable value of land and additions on the property. | Land | Improvement |
|---|---|---|---|---|
| 2025 | $20,229 | $166,800 | $32,079 | $134,721 |
| 2024 | $20,229 | $164,123 | $32,079 | $132,044 |
| 2023 | $16,245 | $162,838 | $32,080 | $130,758 |
| 2022 | $15,690 | $165,094 | $32,081 | $133,013 |
| 2021 | $18,188 | $150,724 | $32,081 | $118,643 |
| 2020 | $15,026 | $166,941 | $32,081 | $134,860 |
| 2019 | $14,317 | $163,188 | $32,081 | $131,107 |
| 2018 | $16,453 | $143,161 | $32,081 | $111,080 |
| 2017 | $16,113 | $151,987 | $32,081 | $119,906 |
| 2016 | $15,279 | $125,608 | $32,081 | $93,527 |
| 2015 | $8,544 | $117,764 | $32,081 | $85,683 |
| 2014 | $8,544 | $117,579 | $32,081 | $85,498 |
Source: Public Records
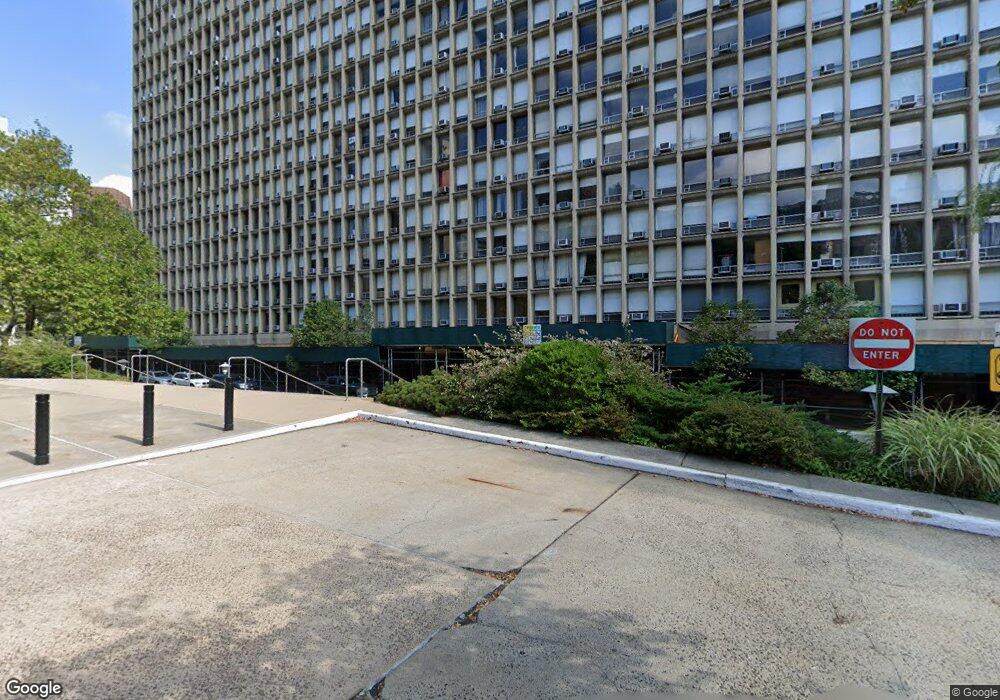
About Kips Bay Towers
Map
Nearby Homes
- 343 E 30th St Unit 1G
- 343 E 30th St Unit 3L
- 343 E 30th St Unit 18P
- 343 E 30th St Unit 16F
- 333 E 30th St Unit 6M
- 330 E 33rd St Unit 7J
- 330 E 33rd St Unit 3N
- 300 E 33rd St Unit 2KL
- 300 E 33rd St Unit 9M
- 300 E 33rd St Unit 21K
- 300 E 33rd St Unit 2K
- 300 E 33rd St Unit 2L
- 250 E 30th St Unit 8B
- 250 E 30th St Unit 14A
- 250 E 30th St Unit 3C
- 250 E 30th St Unit 7F
- 250 E 30th St Unit 6D
- 250 E 30th St Unit 14B
- 251 E 32 St Unit 2-D
- 303 E 33rd St Unit 2-M
- 343 E 30th St
- 343 E 30th St Unit 14H
- 343 E 30th St Unit 14L
- 343 E 30th St Unit 21P
- 343 E 30th St Unit 21N
- 343 E 30th St Unit 21L
- 343 E 30th St Unit 21K
- 343 E 30th St Unit 21J
- 343 E 30th St Unit 21H
- 343 E 30th St Unit 21G
- 343 E 30th St Unit 21F
- 343 E 30th St Unit 21E
- 343 E 30th St Unit 21D
- 343 E 30th St Unit 21C
- 343 E 30th St Unit 21B
- 343 E 30th St Unit 21A
- 343 E 30th St Unit 20P
- 343 E 30th St Unit 20N
- 343 E 30th St Unit 20M
- 343 E 30th St Unit 20L