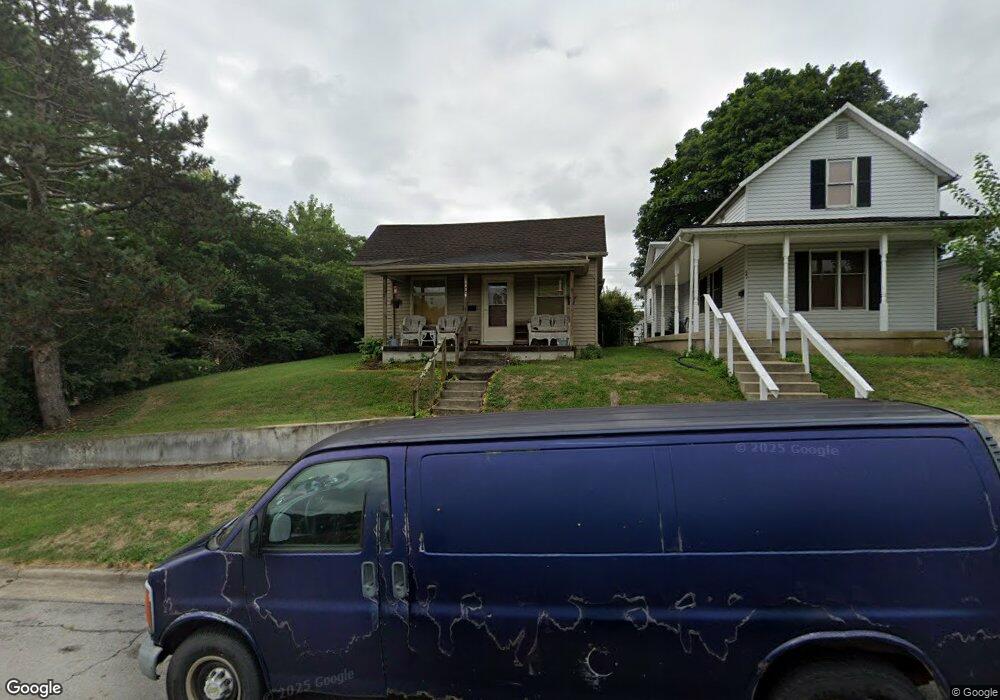
343 E High St Circleville, OH 43113
Estimated Value: $117,000 - $143,420
2
Beds
1
Bath
718
Sq Ft
$182/Sq Ft
Est. Value
About This Home
This home is located at 343 E High St, Circleville, OH 43113 and is currently estimated at $130,605, approximately $181 per square foot. 343 E High St is a home located in Pickaway County with nearby schools including Circleville High School, Crossroads Christian Academy, and New Hope Christian Academy.
Ownership History
Date
Name
Owned For
Owner Type
Purchase Details
Closed on
Jul 19, 2023
Sold by
Robert E Neal Trust
Bought by
Robert E Neal Ii Revocable Trust and Neal
Current Estimated Value
Purchase Details
Closed on
Nov 23, 2009
Sold by
Federal Home Loan Mortgage Corporation
Bought by
Neal Robert E and Robert E Neal Trust
Purchase Details
Closed on
Nov 12, 2009
Sold by
Mullins Edna E
Bought by
Federal Home Loan Mortgage Corp
Create a Home Valuation Report for This Property
The Home Valuation Report is an in-depth analysis detailing your home's value as well as a comparison with similar homes in the area
Home Values in the Area
Average Home Value in this Area
Purchase History
| Date | Buyer | Sale Price | Title Company |
|---|---|---|---|
| Robert E Neal Ii Revocable Trust | -- | None Listed On Document | |
| Robert E Neal Ii Revocable Trust | -- | None Listed On Document | |
| Neal Robert E | $25,400 | None Available | |
| Federal Home Loan Mortgage Corp | $20,000 | None Available |
Source: Public Records
Tax History
| Year | Tax Paid | Tax Assessment Tax Assessment Total Assessment is a certain percentage of the fair market value that is determined by local assessors to be the total taxable value of land and additions on the property. | Land | Improvement |
|---|---|---|---|---|
| 2025 | $2,406 | $31,760 | $8,400 | $23,360 |
| 2024 | $2,406 | $31,760 | $8,400 | $23,360 |
| 2023 | $1,145 | $31,760 | $8,400 | $23,360 |
| 2022 | $1,190 | $26,230 | $7,040 | $19,190 |
| 2021 | $1,198 | $26,230 | $7,040 | $19,190 |
| 2020 | $1,198 | $26,230 | $7,040 | $19,190 |
| 2019 | $1,107 | $22,640 | $7,040 | $15,600 |
| 2018 | $1,136 | $22,640 | $7,040 | $15,600 |
| 2017 | $1,796 | $22,640 | $7,040 | $15,600 |
| 2016 | $1,093 | $21,620 | $7,700 | $13,920 |
| 2015 | $1,094 | $21,620 | $7,700 | $13,920 |
| 2014 | $1,090 | $21,620 | $7,700 | $13,920 |
| 2013 | $1,162 | $22,700 | $7,700 | $15,000 |
Source: Public Records
Map
Nearby Homes
- 416 Stella Ave
- 430 Ruth Ave
- 405 Watt St
- 378 E Franklin St
- 125 N Pickaway St
- 461 Watt St
- 446 E Franklin St
- 231 Westwood Dr
- 550 Springhollow Rd
- 0 Ohio 56 Unit 226002334
- 321 S Pickaway St
- 474 N Court St
- 461 N Court St
- 561 Springhollow Rd
- 157 W High St
- 551 E Main St
- 531 E Franklin St
- 528 N Court St
- 180 Nicholas Dr
- 575 Renick Ave
Your Personal Tour Guide
Ask me questions while you tour the home.