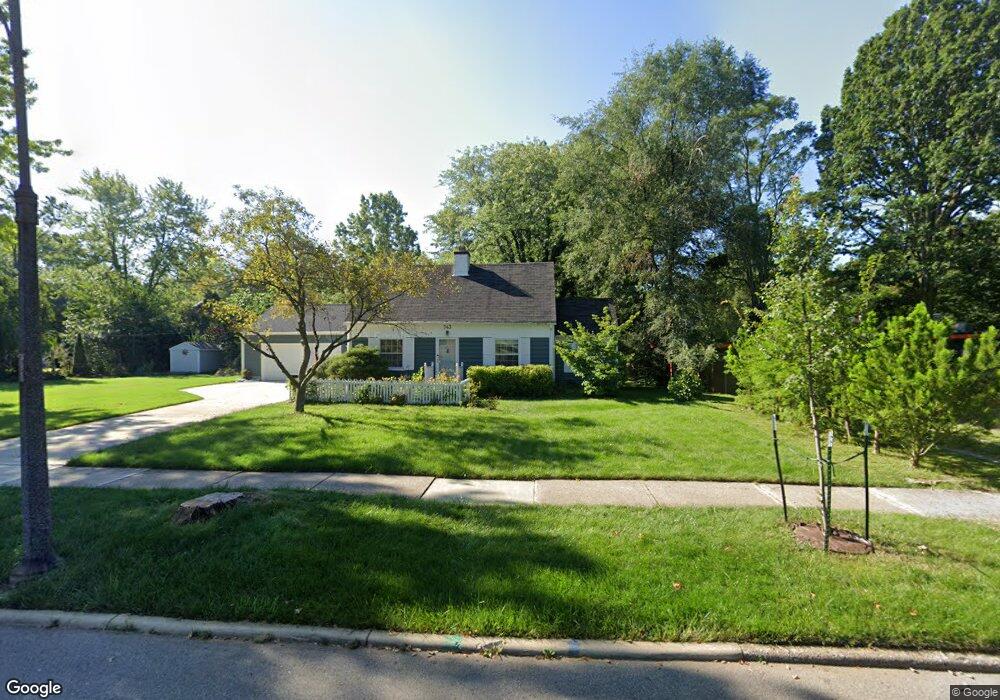
343 Elm St Oberlin, OH 44074
Estimated Value: $260,000 - $334,000
3
Beds
2
Baths
1,726
Sq Ft
$166/Sq Ft
Est. Value
About This Home
This home is located at 343 Elm St, Oberlin, OH 44074 and is currently estimated at $286,393, approximately $165 per square foot. 343 Elm St is a home located in Lorain County with nearby schools including Oberlin Elementary School, Prospect Elementary School, and Langston Middle School.
Ownership History
Date
Name
Owned For
Owner Type
Purchase Details
Closed on
Nov 13, 2020
Sold by
Phinney Thomas C
Bought by
Eveleth Rachel and Koza Mark
Current Estimated Value
Home Financials for this Owner
Home Financials are based on the most recent Mortgage that was taken out on this home.
Original Mortgage
$155,200
Interest Rate
2.8%
Mortgage Type
New Conventional
Purchase Details
Closed on
Nov 23, 1998
Sold by
Walsh James L and Walsh Katherine H
Bought by
Phinney Thomas C and Trimmer Patricia A
Home Financials for this Owner
Home Financials are based on the most recent Mortgage that was taken out on this home.
Original Mortgage
$83,000
Interest Rate
6.96%
Create a Home Valuation Report for This Property
The Home Valuation Report is an in-depth analysis detailing your home's value as well as a comparison with similar homes in the area
Home Values in the Area
Average Home Value in this Area
Purchase History
| Date | Buyer | Sale Price | Title Company |
|---|---|---|---|
| Eveleth Rachel | $172,500 | None Available | |
| Phinney Thomas C | $143,000 | Midland Title |
Source: Public Records
Mortgage History
| Date | Status | Borrower | Loan Amount |
|---|---|---|---|
| Closed | Eveleth Rachel | $155,200 | |
| Closed | Phinney Thomas C | $83,000 |
Source: Public Records
Tax History Compared to Growth
Tax History
| Year | Tax Paid | Tax Assessment Tax Assessment Total Assessment is a certain percentage of the fair market value that is determined by local assessors to be the total taxable value of land and additions on the property. | Land | Improvement |
|---|---|---|---|---|
| 2024 | $3,873 | $78,561 | $14,004 | $64,558 |
| 2023 | $3,371 | $61,383 | $11,099 | $50,285 |
| 2022 | $3,281 | $61,383 | $11,099 | $50,285 |
| 2021 | $3,180 | $61,383 | $11,099 | $50,285 |
| 2020 | $2,964 | $52,220 | $9,730 | $42,490 |
| 2019 | $2,828 | $50,400 | $9,730 | $40,670 |
| 2018 | $2,738 | $50,400 | $9,730 | $40,670 |
| 2017 | $2,629 | $47,900 | $6,310 | $41,590 |
| 2016 | $2,655 | $47,900 | $6,310 | $41,590 |
| 2015 | $2,658 | $47,900 | $6,310 | $41,590 |
| 2014 | $2,570 | $45,190 | $5,950 | $39,240 |
| 2013 | $2,526 | $45,190 | $5,950 | $39,240 |
Source: Public Records
Map
Nearby Homes