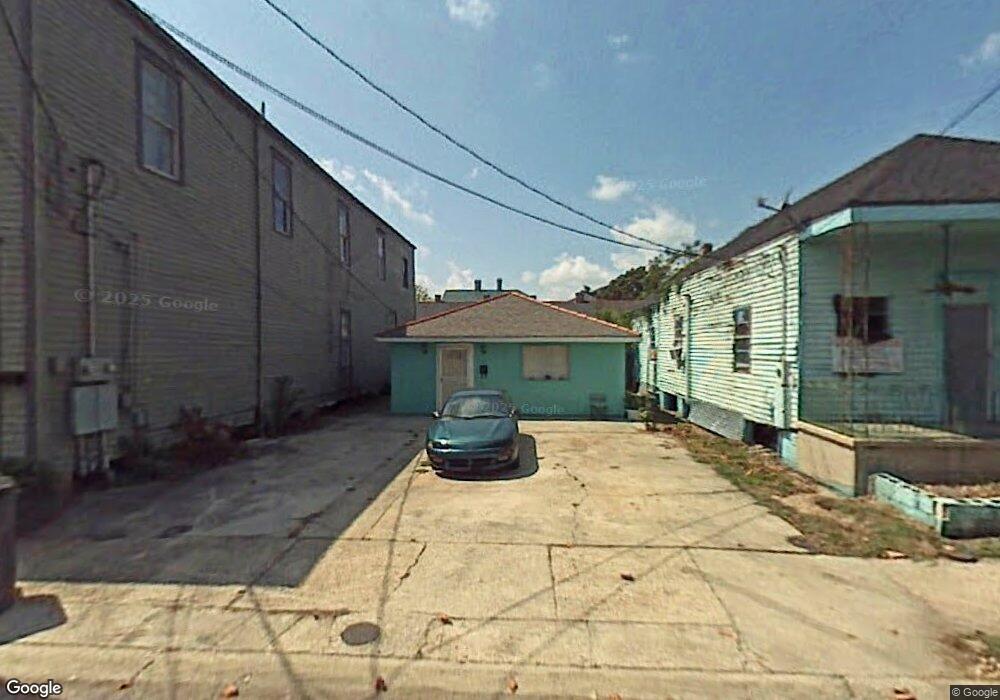
343 Elmira Ave New Orleans, LA 70114
Algiers Point NeighborhoodEstimated Value: $334,521 - $367,000
3
Beds
2
Baths
1,320
Sq Ft
$264/Sq Ft
Est. Value
About This Home
This home is located at 343 Elmira Ave, New Orleans, LA 70114 and is currently estimated at $348,130, approximately $263 per square foot. 343 Elmira Ave is a home located in Orleans Parish with nearby schools including Martin Behrman Charter School Academy of Creative Arts and Sciences, McDonogh #32 Literacy Charter School, and Elan Academy Charter School.
Ownership History
Date
Name
Owned For
Owner Type
Purchase Details
Closed on
Aug 11, 2011
Sold by
Johnson Lenora A L
Bought by
Dupont David A
Current Estimated Value
Home Financials for this Owner
Home Financials are based on the most recent Mortgage that was taken out on this home.
Original Mortgage
$95,027
Outstanding Balance
$66,040
Interest Rate
4.65%
Estimated Equity
$282,090
Create a Home Valuation Report for This Property
The Home Valuation Report is an in-depth analysis detailing your home's value as well as a comparison with similar homes in the area
Home Values in the Area
Average Home Value in this Area
Purchase History
| Date | Buyer | Sale Price | Title Company |
|---|---|---|---|
| Dupont David A | $97,500 | -- |
Source: Public Records
Mortgage History
| Date | Status | Borrower | Loan Amount |
|---|---|---|---|
| Open | Dupont David A | $95,027 |
Source: Public Records
Tax History Compared to Growth
Tax History
| Year | Tax Paid | Tax Assessment Tax Assessment Total Assessment is a certain percentage of the fair market value that is determined by local assessors to be the total taxable value of land and additions on the property. | Land | Improvement |
|---|---|---|---|---|
| 2025 | $2,691 | $27,230 | $4,990 | $22,240 |
| 2024 | $3,649 | $27,230 | $4,990 | $22,240 |
| 2023 | $2,394 | $24,730 | $4,220 | $20,510 |
| 2022 | $2,394 | $23,700 | $4,220 | $19,480 |
| 2021 | $2,596 | $24,730 | $4,220 | $20,510 |
| 2020 | $2,621 | $24,730 | $4,220 | $20,510 |
| 2019 | $1,460 | $16,500 | $5,760 | $10,740 |
| 2018 | $1,487 | $16,500 | $5,760 | $10,740 |
| 2017 | $1,405 | $16,500 | $5,760 | $10,740 |
| 2016 | $559 | $10,800 | $2,690 | $8,110 |
| 2015 | $572 | $10,800 | $2,690 | $8,110 |
| 2014 | -- | $10,800 | $2,690 | $8,110 |
| 2013 | -- | $9,750 | $2,690 | $7,060 |
Source: Public Records
Map
Nearby Homes