Estimated Value: $725,000 - $817,000
4
Beds
2
Baths
1,763
Sq Ft
$436/Sq Ft
Est. Value
About This Home
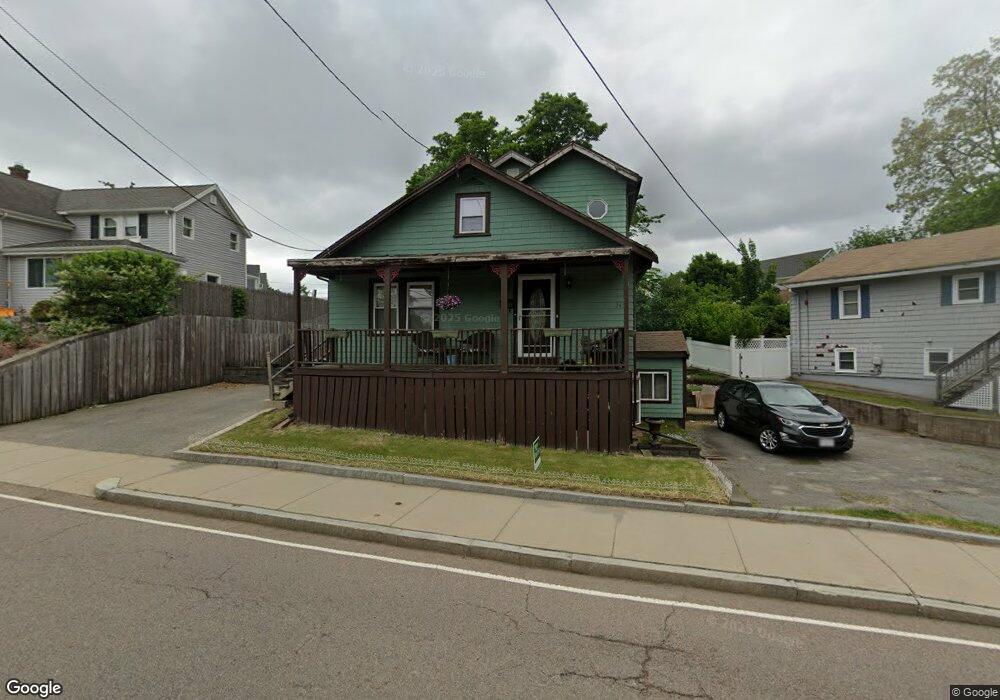
This home is located at 343 Grove St, West Roxbury, MA 02132 and is currently estimated at $768,681, approximately $436 per square foot. 343 Grove St is a home located in Suffolk County with nearby schools including Catholic Memorial School.
Ownership History
Date
Name
Owned For
Owner Type
Purchase Details
Closed on
Dec 16, 1998
Sold by
Bankboston Na
Bought by
Malamphy John R and Malamphy Ann C
Current Estimated Value
Purchase Details
Closed on
Jul 9, 1998
Sold by
Owens Lonzie A and Bankboston Na
Bought by
Bankboston Na
Purchase Details
Closed on
Jun 9, 1989
Sold by
Fedynyshyn Wasil
Bought by
Owens Lonzie A
Create a Home Valuation Report for This Property
The Home Valuation Report is an in-depth analysis detailing your home's value as well as a comparison with similar homes in the area
Home Values in the Area
Average Home Value in this Area
Purchase History
| Date | Buyer | Sale Price | Title Company |
|---|---|---|---|
| Malamphy John R | $125,000 | -- | |
| Bankboston Na | $98,490 | -- | |
| Owens Lonzie A | $102,500 | -- |
Source: Public Records
Mortgage History
| Date | Status | Borrower | Loan Amount |
|---|---|---|---|
| Open | Owens Lonzie A | $288,574 | |
| Closed | Owens Lonzie A | $253,600 |
Source: Public Records
Tax History Compared to Growth
Tax History
| Year | Tax Paid | Tax Assessment Tax Assessment Total Assessment is a certain percentage of the fair market value that is determined by local assessors to be the total taxable value of land and additions on the property. | Land | Improvement |
|---|---|---|---|---|
| 2025 | $7,554 | $652,300 | $182,300 | $470,000 |
| 2024 | $6,506 | $596,900 | $172,200 | $424,700 |
| 2023 | $6,411 | $596,900 | $172,200 | $424,700 |
| 2022 | $5,905 | $542,700 | $156,600 | $386,100 |
| 2021 | $5,339 | $500,400 | $149,100 | $351,300 |
| 2020 | $5,008 | $474,200 | $143,800 | $330,400 |
| 2019 | $4,718 | $447,600 | $117,300 | $330,300 |
| 2018 | $4,342 | $414,300 | $117,300 | $297,000 |
| 2017 | $4,342 | $410,000 | $117,300 | $292,700 |
| 2016 | $4,255 | $386,800 | $117,300 | $269,500 |
| 2015 | $4,730 | $390,600 | $133,900 | $256,700 |
| 2014 | $4,593 | $365,100 | $133,900 | $231,200 |
Source: Public Records
Map
Nearby Homes
- 70 Birchwood St
- 94 Rockland St
- 25R Rockland St Unit 6
- 11 Cheriton Rd Unit 102B
- 83 Mount Hope St
- 235 Curve St
- 150 Grove St
- 69 Berlin St
- 115 Grove St Unit 11
- 111 Grove St Unit 6
- 199 Glenellen Rd
- 191 Glenellen Rd
- 55 Cottage Rd
- 45 Weymouth Ave
- 110 New Haven St
- 108 High St
- 40 Unit 207
- 38 Joan Rd
- 4975 Washington St Unit 306
- 4975 Washington St Unit 311
- 339 Grove St
- 345 Grove St
- 66 Birchwood St
- 62 Birchwood St
- 58 Birchwood St
- 351 Grove St
- 54 Birchwood St Unit 1
- 54 Birchwood St Unit B
- 321 Grove St Unit 18
- 319 Grove St Unit 17
- 317 Grove St Unit 16
- 313 Grove St Unit 14
- 317 Grove St
- 321 Grove St Unit 18,321
- 313 Grove St Unit 313
- 52 Birchwood St
- 315 Grove St Unit 15
- 311 Grove St Unit 13
- 63 Birchwood St
- 73 Birchwood St