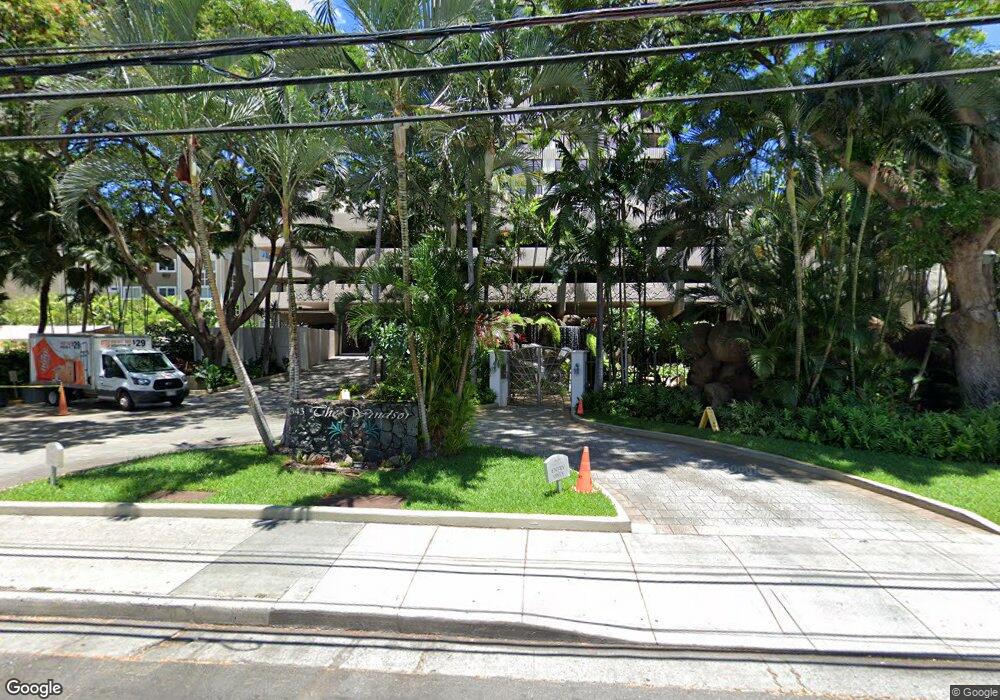
Windsor Condos 343 Hobron Ln Unit 3003 Honolulu, HI 96815
Waikiki NeighborhoodEstimated Value: $685,000 - $813,000
2
Beds
2
Baths
1,046
Sq Ft
$724/Sq Ft
Est. Value
About This Home
This home is located at 343 Hobron Ln Unit 3003, Honolulu, HI 96815 and is currently estimated at $757,771, approximately $724 per square foot. 343 Hobron Ln Unit 3003 is a home located in Honolulu County with nearby schools including President Thomas Jefferson Elementary School, President George Washington Middle School, and Kaimuki High School.
Ownership History
Date
Name
Owned For
Owner Type
Purchase Details
Closed on
Feb 7, 2019
Sold by
Sabatini Nelson John and Sabatini Marilyn Jean
Bought by
Sabatini Nelson J and The Nelson J Sabatini Revocabl
Current Estimated Value
Purchase Details
Closed on
Jun 16, 2010
Sold by
Demeuse Leslie Jean
Bought by
Sabatini Nelson John and Sabatini Marilyn Jean
Purchase Details
Closed on
Oct 10, 2007
Sold by
Monaco Anthony John and Monaco Elizabeth Heidi
Bought by
Demeuse Leslie Jean
Home Financials for this Owner
Home Financials are based on the most recent Mortgage that was taken out on this home.
Original Mortgage
$564,000
Interest Rate
6.4%
Mortgage Type
Unknown
Purchase Details
Closed on
Feb 18, 2004
Sold by
Hobron Hotel Llc
Bought by
Monaco Anthony John and Monaco Elizabeth Heidi
Home Financials for this Owner
Home Financials are based on the most recent Mortgage that was taken out on this home.
Original Mortgage
$370,170
Interest Rate
4.87%
Mortgage Type
Unknown
Create a Home Valuation Report for This Property
The Home Valuation Report is an in-depth analysis detailing your home's value as well as a comparison with similar homes in the area
Home Values in the Area
Average Home Value in this Area
Purchase History
| Date | Buyer | Sale Price | Title Company |
|---|---|---|---|
| Sabatini Nelson J | -- | Accommodation | |
| Sabatini Nelson J | -- | Accommodation | |
| Sabatini Nelson John | $689,000 | Itc | |
| Demeuse Leslie Jean | $705,000 | Fam | |
| Monaco Anthony John | $490,300 | -- |
Source: Public Records
Mortgage History
| Date | Status | Borrower | Loan Amount |
|---|---|---|---|
| Previous Owner | Demeuse Leslie Jean | $564,000 | |
| Previous Owner | Monaco Anthony John | $370,170 |
Source: Public Records
Tax History Compared to Growth
Tax History
| Year | Tax Paid | Tax Assessment Tax Assessment Total Assessment is a certain percentage of the fair market value that is determined by local assessors to be the total taxable value of land and additions on the property. | Land | Improvement |
|---|---|---|---|---|
| 2025 | $2,832 | $793,000 | $105,100 | $687,900 |
| 2024 | $2,832 | $809,000 | $105,100 | $703,900 |
| 2023 | $3,026 | $864,500 | $103,700 | $760,800 |
| 2022 | $2,549 | $728,400 | $100,800 | $627,600 |
| 2021 | $2,508 | $716,600 | $100,800 | $615,800 |
| 2020 | $2,485 | $710,000 | $95,000 | $615,000 |
| 2019 | $2,777 | $793,300 | $92,100 | $701,200 |
| 2018 | $2,751 | $786,100 | $90,700 | $695,400 |
| 2017 | $2,680 | $765,700 | $86,400 | $679,300 |
| 2016 | $2,600 | $742,800 | $79,200 | $663,600 |
| 2015 | $2,711 | $774,700 | $72,000 | $702,700 |
| 2014 | $2,449 | $709,500 | $69,100 | $640,400 |
Source: Public Records
About Windsor Condos
Map
Nearby Homes
- 343 Hobron Ln Unit 2701
- 343 Hobron Ln Unit L103
- 343 Hobron Ln Unit 3901
- 343 Hobron Ln Unit 3401
- 343 Hobron Ln Unit 4202
- 343 Hobron Ln Unit 1404
- 1810 Kaioo Dr Unit B310
- 1778 Ala Moana Blvd Unit 2616
- 1778 Ala Moana Blvd Unit 1015
- 1778 Ala Moana Blvd Unit 3205
- 1778 Ala Moana Blvd Unit 3306
- 1778 Ala Moana Blvd Unit 2814
- 1778 Ala Moana Blvd Unit 3918
- 1778 Ala Moana Blvd Unit 1817
- 1778 Ala Moana Blvd Unit PH14
- 1778 Ala Moana Blvd Unit 3903
- 1778 Ala Moana Blvd Unit 2816
- 1778 Ala Moana Blvd Unit 2809
- 1778 Ala Moana Blvd Unit 1217
- 1778 Ala Moana Blvd Unit 1211
- 343 Hobron Ln Unit 3801
- 343 Hobron Ln Unit 4203
- 343 Hobron Ln Unit 2601
- 343 Hobron Ln Unit 3201
- 343 Hobron Ln Unit 1603
- 343 Hobron Ln Unit 1401
- 343 Hobron Ln Unit 3904
- 343 Hobron Ln Unit 4003
- 343 Hobron Ln Unit 2903
- 343 Hobron Ln Unit 3704
- 343 Hobron Ln Unit 1203
- 343 Hobron Ln Unit 4002
- 343 Hobron Ln Unit 603
- 343 Hobron Ln Unit 3503
- 343 Hobron Ln Unit 1904
- 343 Hobron Ln Unit 3903
- 343 Hobron Ln Unit 2305
- 343 Hobron Ln Unit L101
- 343 Hobron Ln Unit 3404
- 343 Hobron Ln Unit 802