343 North St Georgetown, MA 01833
Estimated Value: $667,000 - $790,000
3
Beds
2
Baths
1,558
Sq Ft
$472/Sq Ft
Est. Value
About This Home
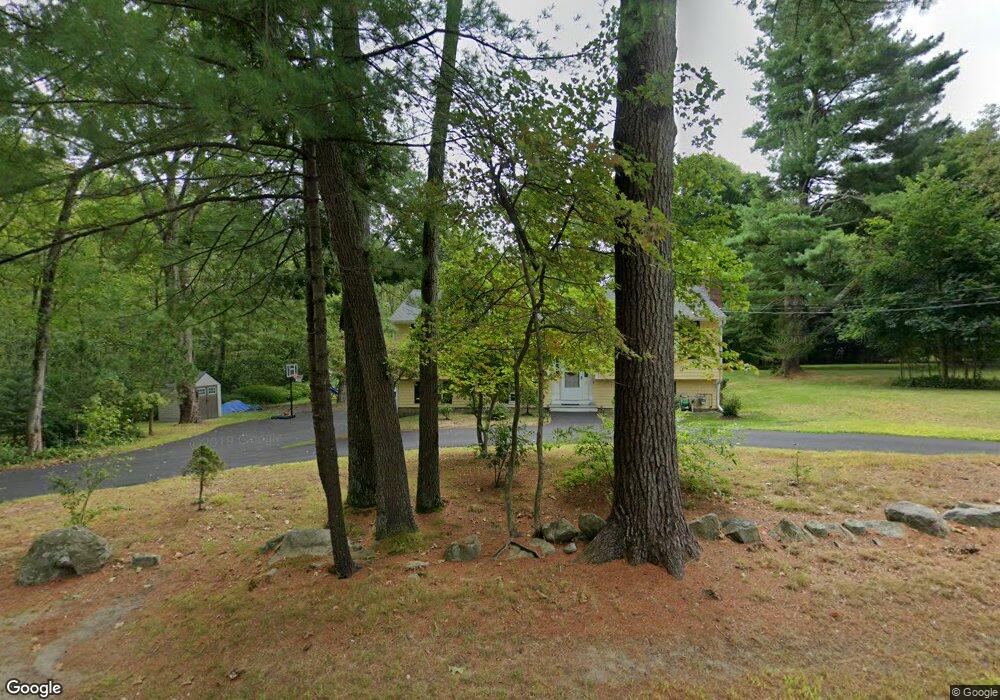
This home is located at 343 North St, Georgetown, MA 01833 and is currently estimated at $735,180, approximately $471 per square foot. 343 North St is a home located in Essex County with nearby schools including Perley Elementary School, Penn Brook School, and Georgetown High School.
Ownership History
Date
Name
Owned For
Owner Type
Purchase Details
Closed on
Jan 29, 2010
Sold by
Cris Investment Llc
Bought by
Kasper James C and Kasper Allison
Current Estimated Value
Home Financials for this Owner
Home Financials are based on the most recent Mortgage that was taken out on this home.
Original Mortgage
$250,000
Interest Rate
4.95%
Mortgage Type
Purchase Money Mortgage
Purchase Details
Closed on
Jan 28, 2010
Sold by
Salvaggio John C
Bought by
Cris Investments Llc
Home Financials for this Owner
Home Financials are based on the most recent Mortgage that was taken out on this home.
Original Mortgage
$250,000
Interest Rate
4.95%
Mortgage Type
Purchase Money Mortgage
Purchase Details
Closed on
Nov 17, 2008
Sold by
Salvaggio John C and Salvaggio Antonetta C
Bought by
Us Bk
Purchase Details
Closed on
Aug 10, 2000
Sold by
Julien Robert M and Julien Wendy L
Bought by
Salvaggio John C and Salvaggio Antonetta C
Purchase Details
Closed on
Oct 7, 1994
Sold by
Heilmann Norbert
Bought by
Julien Robert M and Julien Wendy
Purchase Details
Closed on
Sep 11, 1989
Sold by
Kirschner Robert
Bought by
Heilmann Norbert
Purchase Details
Closed on
Sep 18, 1987
Sold by
White Philip J
Bought by
Kirschner Robert C
Create a Home Valuation Report for This Property
The Home Valuation Report is an in-depth analysis detailing your home's value as well as a comparison with similar homes in the area
Home Values in the Area
Average Home Value in this Area
Purchase History
| Date | Buyer | Sale Price | Title Company |
|---|---|---|---|
| Kasper James C | $320,000 | -- | |
| Cris Investments Llc | $162,000 | -- | |
| Us Bk | $246,050 | -- | |
| Salvaggio John C | $292,500 | -- | |
| Julien Robert M | $186,000 | -- | |
| Heilmann Norbert | $190,000 | -- | |
| Kirschner Robert C | $190,000 | -- |
Source: Public Records
Mortgage History
| Date | Status | Borrower | Loan Amount |
|---|---|---|---|
| Open | Kirschner Robert C | $243,000 | |
| Closed | Kirschner Robert C | $250,000 |
Source: Public Records
Tax History Compared to Growth
Tax History
| Year | Tax Paid | Tax Assessment Tax Assessment Total Assessment is a certain percentage of the fair market value that is determined by local assessors to be the total taxable value of land and additions on the property. | Land | Improvement |
|---|---|---|---|---|
| 2025 | $7,279 | $658,100 | $279,600 | $378,500 |
| 2024 | $6,738 | $536,900 | $192,800 | $344,100 |
| 2023 | $6,969 | $536,900 | $192,800 | $344,100 |
| 2022 | $6,575 | $467,000 | $167,600 | $299,400 |
| 2021 | $7,313 | $460,200 | $167,600 | $292,600 |
| 2020 | $6,947 | $436,400 | $167,600 | $268,800 |
| 2019 | $6,743 | $427,300 | $164,400 | $262,900 |
| 2018 | $5,745 | $361,800 | $164,400 | $197,400 |
| 2017 | $5,865 | $361,800 | $164,400 | $197,400 |
| 2016 | $5,742 | $361,800 | $164,400 | $197,400 |
| 2015 | $5,620 | $350,600 | $164,400 | $186,200 |
| 2014 | $4,642 | $330,400 | $164,400 | $166,000 |
Source: Public Records
Map
Nearby Homes