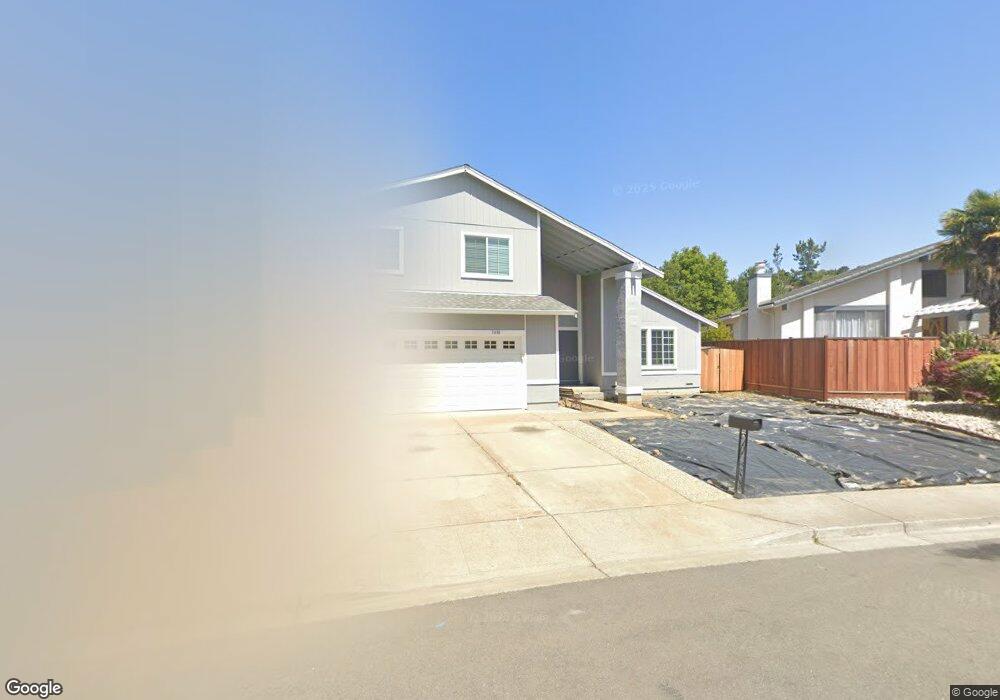
3430 Otter Ct Hayward, CA 94542
Hayward Highland NeighborhoodEstimated Value: $1,269,000 - $1,408,000
4
Beds
3
Baths
2,248
Sq Ft
$588/Sq Ft
Est. Value
About This Home
This home is located at 3430 Otter Ct, Hayward, CA 94542 and is currently estimated at $1,322,734, approximately $588 per square foot. 3430 Otter Ct is a home located in Alameda County with nearby schools including Stonebrae Elementary School, Bret Harte Middle School, and Hayward High School.
Ownership History
Date
Name
Owned For
Owner Type
Purchase Details
Closed on
Sep 14, 2018
Sold by
Sweany John M and Sweany Pamela L
Bought by
Armas John and Armas Kenia
Current Estimated Value
Home Financials for this Owner
Home Financials are based on the most recent Mortgage that was taken out on this home.
Original Mortgage
$704,000
Outstanding Balance
$613,986
Interest Rate
4.6%
Mortgage Type
New Conventional
Estimated Equity
$708,748
Purchase Details
Closed on
Jun 16, 1995
Sold by
Shen Andrew Pei Eng
Bought by
Cheang Monica Fung Mei
Purchase Details
Closed on
Aug 10, 1994
Sold by
Shen Yen and Shen Hui
Bought by
Shen Andrew Pei Eng and Cheang Monica Fung Mei
Home Financials for this Owner
Home Financials are based on the most recent Mortgage that was taken out on this home.
Original Mortgage
$175,000
Interest Rate
8.37%
Create a Home Valuation Report for This Property
The Home Valuation Report is an in-depth analysis detailing your home's value as well as a comparison with similar homes in the area
Home Values in the Area
Average Home Value in this Area
Purchase History
| Date | Buyer | Sale Price | Title Company |
|---|---|---|---|
| Armas John | $880,000 | North American Title Company | |
| Cheang Monica Fung Mei | -- | -- | |
| Shen Andrew Pei Eng | $250,000 | First American Title |
Source: Public Records
Mortgage History
| Date | Status | Borrower | Loan Amount |
|---|---|---|---|
| Open | Armas John | $704,000 | |
| Previous Owner | Shen Andrew Pei Eng | $175,000 |
Source: Public Records
Tax History Compared to Growth
Tax History
| Year | Tax Paid | Tax Assessment Tax Assessment Total Assessment is a certain percentage of the fair market value that is determined by local assessors to be the total taxable value of land and additions on the property. | Land | Improvement |
|---|---|---|---|---|
| 2025 | $11,774 | $981,640 | $294,492 | $687,148 |
| 2024 | $11,774 | $962,394 | $288,718 | $673,676 |
| 2023 | $11,598 | $943,527 | $283,058 | $660,469 |
| 2022 | $11,370 | $925,028 | $277,508 | $647,520 |
| 2021 | $11,279 | $906,891 | $272,067 | $634,824 |
| 2020 | $11,152 | $897,600 | $269,280 | $628,320 |
| 2019 | $11,246 | $880,000 | $264,000 | $616,000 |
| 2018 | $4,670 | $372,007 | $111,645 | $260,362 |
| 2017 | $4,564 | $364,714 | $109,456 | $255,258 |
| 2016 | $4,297 | $357,564 | $107,310 | $250,254 |
| 2015 | $4,212 | $352,195 | $105,699 | $246,496 |
| 2014 | $4,003 | $345,297 | $103,629 | $241,668 |
Source: Public Records
Map
Nearby Homes
- 3446 Eureka Ct
- 27896 Adobe Ct
- 3274 Red Leaf Ct
- 27050 Vista Bahia Way
- 2743 Gamble Ct
- 0 Parkside Dr
- 0 Hayward Blvd Unit 41103610
- 27030 Parkside Dr
- 4520 Riding Club Ct
- 2485 Saint Helena Dr Unit 3
- 0 Chronicle Ave Unit 41091503
- 0 Fairview Unit 41108563
- 192 Carrick Cir
- 2437 Saint Helena Dr Unit 3
- 2419 Saint Helena Dr Unit 6
- 35 Arundel Dr
- 28784 Vista Grande Dr
- 3981 Amyx Ct
- 28973 Parkridge Loop Unit 94
- 803 Maybeck Place
- 3434 Otter Ct
- 3426 Otter Ct
- 3427 Pinewood Dr
- 3419 Pinewood Dr
- 3442 Otter Ct
- 3422 Otter Ct
- 3429 Otter Ct
- 3411 Pinewood Dr
- 3441 Otter Ct
- 3443 Pinewood Dr
- 3415 Otter Ct
- 3415 Otter Ct
- 3450 Otter Ct
- 3418 Otter Ct
- 27988 Farm Hill Dr
- 3451 Pinewood Dr
- 3449 Otter Ct
- 3414 Otter Ct
- 3414 Otter Ct
- 3420 Pinewood Dr