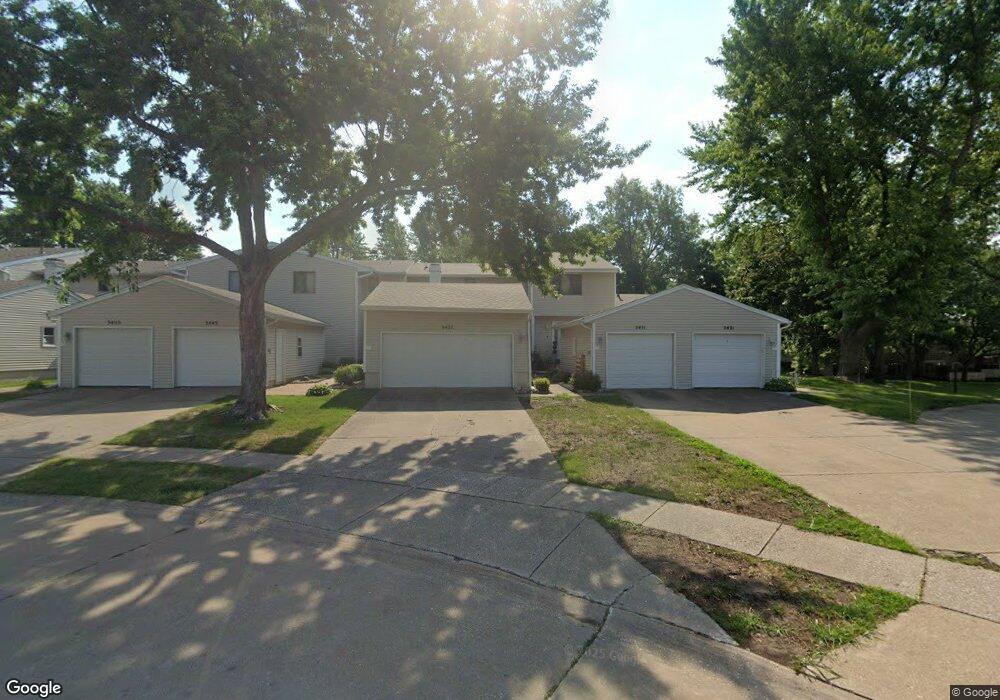
3431 Cedarview Ct Bettendorf, IA 52722
Estimated Value: $199,000 - $238,000
2
Beds
2
Baths
1,184
Sq Ft
$178/Sq Ft
Est. Value
About This Home
This home is located at 3431 Cedarview Ct, Bettendorf, IA 52722 and is currently estimated at $210,454, approximately $177 per square foot. 3431 Cedarview Ct is a home located in Scott County with nearby schools including Riverdale Heights Elementary, Pleasant Valley Junior High School, and Pleasant Valley High School.
Ownership History
Date
Name
Owned For
Owner Type
Purchase Details
Closed on
Aug 27, 2021
Sold by
Cook Douglas H and Cook Molli
Bought by
Alpen Britta
Current Estimated Value
Home Financials for this Owner
Home Financials are based on the most recent Mortgage that was taken out on this home.
Original Mortgage
$171,900
Outstanding Balance
$155,733
Interest Rate
2.8%
Mortgage Type
New Conventional
Estimated Equity
$54,721
Purchase Details
Closed on
Jan 8, 2016
Sold by
Libanksy Judith A and Libanksy Richard J
Bought by
Larson Kelly L
Purchase Details
Closed on
Sep 16, 2010
Sold by
Moskowitz Amy L and Moskowitz Andrew G
Bought by
Jansen Judith A
Home Financials for this Owner
Home Financials are based on the most recent Mortgage that was taken out on this home.
Original Mortgage
$51,125
Interest Rate
4.49%
Mortgage Type
FHA
Create a Home Valuation Report for This Property
The Home Valuation Report is an in-depth analysis detailing your home's value as well as a comparison with similar homes in the area
Home Values in the Area
Average Home Value in this Area
Purchase History
| Date | Buyer | Sale Price | Title Company |
|---|---|---|---|
| Alpen Britta | $191,000 | None Listed On Document | |
| Larson Kelly L | $138,000 | None Available | |
| Jansen Judith A | $133,000 | None Available |
Source: Public Records
Mortgage History
| Date | Status | Borrower | Loan Amount |
|---|---|---|---|
| Open | Alpen Britta | $171,900 | |
| Previous Owner | Jansen Judith A | $51,125 |
Source: Public Records
Tax History Compared to Growth
Tax History
| Year | Tax Paid | Tax Assessment Tax Assessment Total Assessment is a certain percentage of the fair market value that is determined by local assessors to be the total taxable value of land and additions on the property. | Land | Improvement |
|---|---|---|---|---|
| 2025 | $2,998 | $198,400 | $11,300 | $187,100 |
| 2024 | $3,044 | $194,700 | $13,400 | $181,300 |
| 2023 | $3,168 | $194,700 | $13,400 | $181,300 |
| 2022 | $2,816 | $174,170 | $13,400 | $160,770 |
| 2021 | $2,816 | $156,310 | $13,400 | $142,910 |
| 2020 | $2,712 | $145,390 | $13,400 | $131,990 |
| 2019 | $2,490 | $132,000 | $13,400 | $118,600 |
| 2018 | $2,282 | $132,000 | $13,400 | $118,600 |
| 2017 | $734 | $132,000 | $13,400 | $118,600 |
| 2016 | $2,090 | $119,760 | $0 | $0 |
| 2015 | $2,090 | $114,300 | $0 | $0 |
| 2014 | $2,014 | $114,300 | $0 | $0 |
| 2013 | $1,974 | $0 | $0 | $0 |
| 2012 | -- | $115,550 | $10,590 | $104,960 |
Source: Public Records
Map
Nearby Homes
- 3461 Cedarview Ct
- 3542 Cedarview Ct
- 3550 Devils Glen Rd
- 3161 Willowwood Dr
- 3752 Cedarwood Ct
- 3750 Eastwood Ct
- 3766 Eastwood Ct
- 3075 Willowwood Dr
- 4000 Prairie Ln
- 4383 53rd Ave
- 3988 Partridge Cir
- 3260 Parkwild Dr Unit 3D
- 4190 Mallard Ct Unit 10
- 3374 N Willow Ct
- 3309 Winston Dr
- 3121 Middle Haven Rd
- 3885 Middle Rd
- 4334 Augusta Ct
- 4030 Woodfield Dr
- 3295 Ridge Point Unit Lot 6
- 3437 Cedarview Ct
- 3421 Cedarview Ct
- 3445 Cedarview Ct
- 3453 Cedarview Ct
- 3467 Cedarview Ct
- 3416 Cedarview Ct
- 3426 Cedarview Ct
- 3475 Cedarview Ct
- 3430 Cedarview Ct
- 3322 Johnathan Ave
- 3326 Johnathan Ave
- 3324 Johnathan Ave
- 3328 Johnathan Ave
- 3440 Cedarview Ct
- 3320 Johnathan Ave
- 3330 Johnathan Ave
- 3318 Johnathan Ave
- 3450 Cedarview Ct
- 3316 Johnathan Ave
- 3489 Cedarview Ct