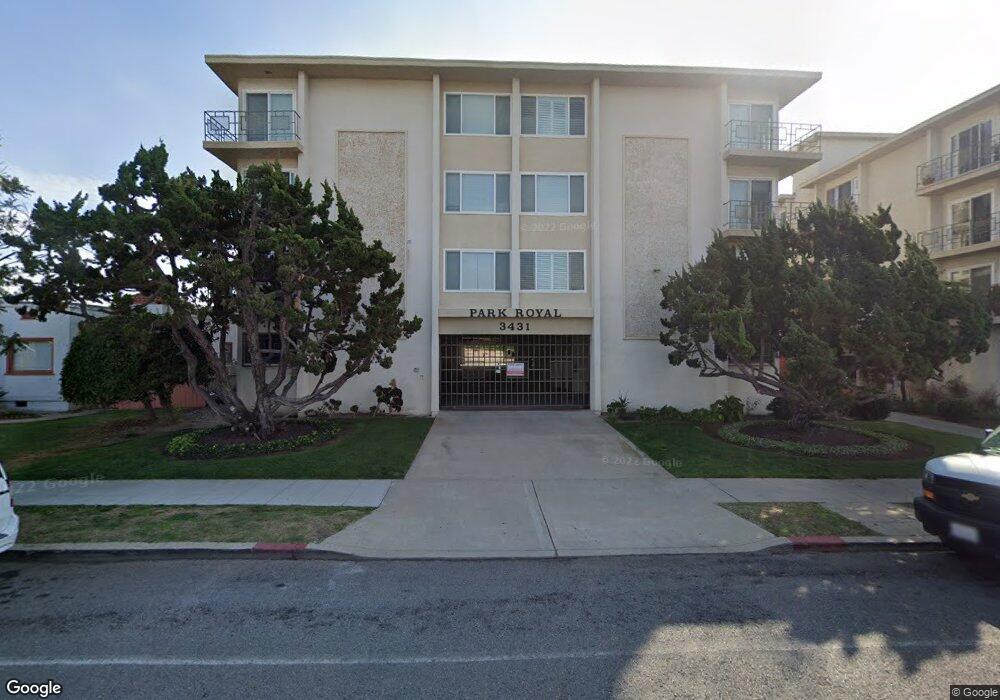
3431 Park Blvd Unit 301 San Diego, CA 92103
North Park NeighborhoodEstimated Value: $578,280 - $668,000
2
Beds
2
Baths
953
Sq Ft
$675/Sq Ft
Est. Value
About This Home
This home is located at 3431 Park Blvd Unit 301, San Diego, CA 92103 and is currently estimated at $642,820, approximately $674 per square foot. 3431 Park Blvd Unit 301 is a home located in San Diego County with nearby schools including Jefferson Elementary, Roosevelt International Middle School, and Kindred Montessori.
Ownership History
Date
Name
Owned For
Owner Type
Purchase Details
Closed on
Jul 16, 2012
Sold by
Quince Joseph S
Bought by
Quince Josephine E
Current Estimated Value
Purchase Details
Closed on
Sep 25, 1996
Sold by
Ludwig Rose M
Bought by
The Rose M Ludwig Living Trust
Home Financials for this Owner
Home Financials are based on the most recent Mortgage that was taken out on this home.
Original Mortgage
$34,500
Interest Rate
8.23%
Purchase Details
Closed on
Sep 11, 1996
Sold by
Kingston Thomas Boyle
Bought by
Ludwig Rose M
Home Financials for this Owner
Home Financials are based on the most recent Mortgage that was taken out on this home.
Original Mortgage
$34,500
Interest Rate
8.23%
Purchase Details
Closed on
Aug 13, 1996
Sold by
Kingston William A and Boyle Thomas Boyle
Bought by
Kingston Thomas Boyle
Home Financials for this Owner
Home Financials are based on the most recent Mortgage that was taken out on this home.
Original Mortgage
$34,500
Interest Rate
8.23%
Create a Home Valuation Report for This Property
The Home Valuation Report is an in-depth analysis detailing your home's value as well as a comparison with similar homes in the area
Home Values in the Area
Average Home Value in this Area
Purchase History
| Date | Buyer | Sale Price | Title Company |
|---|---|---|---|
| Quince Josephine E | -- | None Available | |
| The Rose M Ludwig Living Trust | -- | Commonwealth Land Title Ins | |
| Ludwig Rose M | $84,500 | Commonwealth Land Title Co | |
| Kingston Thomas Boyle | -- | -- |
Source: Public Records
Mortgage History
| Date | Status | Borrower | Loan Amount |
|---|---|---|---|
| Closed | Ludwig Rose M | $34,500 |
Source: Public Records
Tax History Compared to Growth
Tax History
| Year | Tax Paid | Tax Assessment Tax Assessment Total Assessment is a certain percentage of the fair market value that is determined by local assessors to be the total taxable value of land and additions on the property. | Land | Improvement |
|---|---|---|---|---|
| 2025 | $1,689 | $137,592 | $72,460 | $65,132 |
| 2024 | $1,689 | $134,895 | $71,040 | $63,855 |
| 2023 | $1,651 | $132,251 | $69,648 | $62,603 |
| 2022 | $1,607 | $129,659 | $68,283 | $61,376 |
| 2021 | $1,597 | $127,118 | $66,945 | $60,173 |
| 2020 | $1,578 | $125,815 | $66,259 | $59,556 |
| 2019 | $1,550 | $123,349 | $64,960 | $58,389 |
| 2018 | $1,451 | $120,932 | $63,687 | $57,245 |
| 2017 | $1,416 | $118,562 | $62,439 | $56,123 |
| 2016 | $1,393 | $116,238 | $61,215 | $55,023 |
| 2015 | $1,373 | $114,493 | $60,296 | $54,197 |
| 2014 | $1,352 | $112,251 | $59,115 | $53,136 |
Source: Public Records
Map
Nearby Homes
- 3524-26 Georgia St
- 3620 Park Blvd Unit 11
- 3420-30 Wilshire Terrace
- 3405 Florida St Unit 410
- 3721 Indiana St
- 3740 Park Blvd Unit 210
- 1607 1609 Robinson Ave
- 1271 Brookes Terrace
- 1907 Robinson Ave Unit 309
- 3678 Richmond St
- 3770 Georgia St
- 3760 Florida St
- 3760 Florida St Unit 209
- 3660 Mississippi St
- 3536 Louisiana St
- 1756 Essex St Unit 311
- 1010 Myrtle Way
- 3812 Park Blvd Unit 412
- 3812 Park Blvd Unit 414
- 3812 Park Blvd Unit 507
- 3421 Park Blvd
- 3431 Park Blvd
- 3421 Park Blvd
- 3431 Park Blvd Unit 402
- 3431 Park Blvd Unit 304
- 3431 Park Blvd Unit 303
- 3431 Park Blvd Unit 302
- 3431 Park Blvd Unit 207
- 3431 Park Blvd Unit 206
- 3431 Park Blvd Unit 205
- 3431 Park Blvd Unit 204
- 3431 Park Blvd Unit 203
- 3431 Park Blvd Unit 202
- 3431 Park Blvd Unit 201
- 3421 Park Blvd Unit 407
- 3421 Park Blvd Unit 406
- 3421 Park Blvd Unit 405
- 3421 Park Blvd Unit 404
- 3421 Park Blvd Unit 403
- 3431 Park Blvd Unit 407