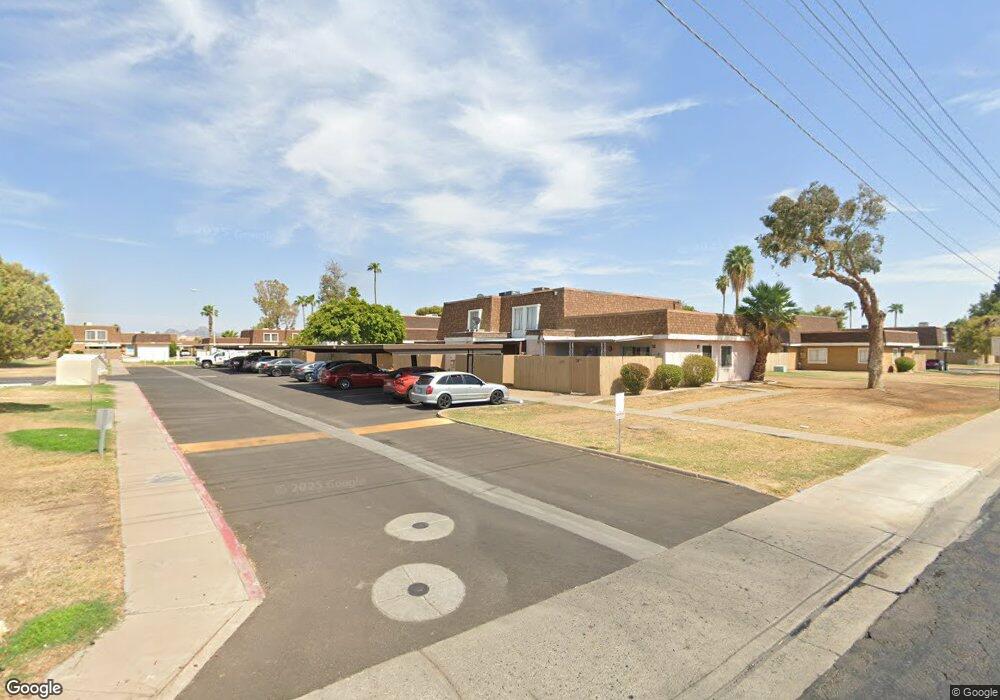
3433 W Laurie Ln Unit 72 Phoenix, AZ 85051
North Mountain Village NeighborhoodEstimated Value: $171,910 - $226,000
3
Beds
1
Bath
1,008
Sq Ft
$200/Sq Ft
Est. Value
About This Home
This home is located at 3433 W Laurie Ln Unit 72, Phoenix, AZ 85051 and is currently estimated at $201,978, approximately $200 per square foot. 3433 W Laurie Ln Unit 72 is a home located in Maricopa County with nearby schools including Palo Verde Middle School, Alta Vista Elementary School, and Cortez High School.
Ownership History
Date
Name
Owned For
Owner Type
Purchase Details
Closed on
Jun 24, 2005
Sold by
Stolla Nebi and Stolla Sehadete
Bought by
Stolla Nebi
Current Estimated Value
Home Financials for this Owner
Home Financials are based on the most recent Mortgage that was taken out on this home.
Original Mortgage
$81,000
Outstanding Balance
$43,880
Interest Rate
6.35%
Mortgage Type
Purchase Money Mortgage
Estimated Equity
$158,098
Purchase Details
Closed on
Apr 29, 2003
Sold by
Green Angela
Bought by
Stolla Nebi and Stolla Sehadete
Home Financials for this Owner
Home Financials are based on the most recent Mortgage that was taken out on this home.
Original Mortgage
$67,900
Interest Rate
5.72%
Mortgage Type
FHA
Purchase Details
Closed on
Feb 28, 2001
Sold by
Butler Michele and Butler Michele M
Bought by
Green Angela
Home Financials for this Owner
Home Financials are based on the most recent Mortgage that was taken out on this home.
Original Mortgage
$61,110
Interest Rate
7.11%
Mortgage Type
FHA
Create a Home Valuation Report for This Property
The Home Valuation Report is an in-depth analysis detailing your home's value as well as a comparison with similar homes in the area
Home Values in the Area
Average Home Value in this Area
Purchase History
| Date | Buyer | Sale Price | Title Company |
|---|---|---|---|
| Stolla Nebi | -- | Stellar Title | |
| Stolla Nebi | $70,000 | American Title Ins Agency Az | |
| Green Angela | $63,000 | Equity Title Agency Inc |
Source: Public Records
Mortgage History
| Date | Status | Borrower | Loan Amount |
|---|---|---|---|
| Open | Stolla Nebi | $81,000 | |
| Closed | Stolla Nebi | $67,900 | |
| Previous Owner | Green Angela | $61,110 |
Source: Public Records
Tax History Compared to Growth
Tax History
| Year | Tax Paid | Tax Assessment Tax Assessment Total Assessment is a certain percentage of the fair market value that is determined by local assessors to be the total taxable value of land and additions on the property. | Land | Improvement |
|---|---|---|---|---|
| 2025 | $315 | $2,822 | -- | -- |
| 2024 | $297 | $2,688 | -- | -- |
| 2023 | $297 | $13,460 | $2,690 | $10,770 |
| 2022 | $286 | $10,160 | $2,030 | $8,130 |
| 2021 | $293 | $8,830 | $1,760 | $7,070 |
| 2020 | $285 | $7,220 | $1,440 | $5,780 |
| 2019 | $280 | $5,510 | $1,100 | $4,410 |
| 2018 | $272 | $4,460 | $890 | $3,570 |
| 2017 | $271 | $3,630 | $720 | $2,910 |
| 2016 | $267 | $3,300 | $660 | $2,640 |
| 2015 | $247 | $2,830 | $560 | $2,270 |
Source: Public Records
Map
Nearby Homes
- 8235 N 34th Dr Unit 160
- 8451 N 34th Ave
- 8428 N 33rd Dr
- 3412 W Butler Dr
- 8213 N 33rd Ln
- 3510 W Seldon Ln
- 3501 W Diana Ave
- 8544 N 33rd Ave
- 3352 W Harmont Dr
- 8410 N 32nd Ave
- 3357 W Harmont Dr
- 3636 W Echo Ln
- 3701 W Echo Ln Unit 4
- 8108 N 33rd Dr
- 3714 W Echo Ln
- 3619 W Griswold Rd
- 3701 W Griswold Rd
- 8056 N 32nd Ln
- 8036 N 32nd Ln
- 3331 W Del Monico Ln
- 3437 W Laurie Ln
- 3431 W Laurie Ln Unit 71
- 3435 W Laurie Ln Unit 73
- 3429 W Laurie Ln Unit 70
- 3439 W Laurie Ln Unit 75
- 3427 W Laurie Ln Unit 69
- 3436 W El Caminito Dr
- 3425 W Laurie Ln Unit 68
- 3434 W El Caminito Dr
- 3434 W El Caminito Dr
- 3434 W El Caminito Dr Unit 28
- 3430 W El Caminito Dr
- 3430 W El Caminito Dr Unit 26
- 3423 W Laurie Ln Unit 67
- 3428 W El Caminito Dr
- 3428 W El Caminito Dr Unit 33
- 3421 W Laurie Ln Unit 66
- 3438 W El Caminito Dr Unit 30
- 3438 W El Caminito Dr
- 3424 W El Caminito Dr