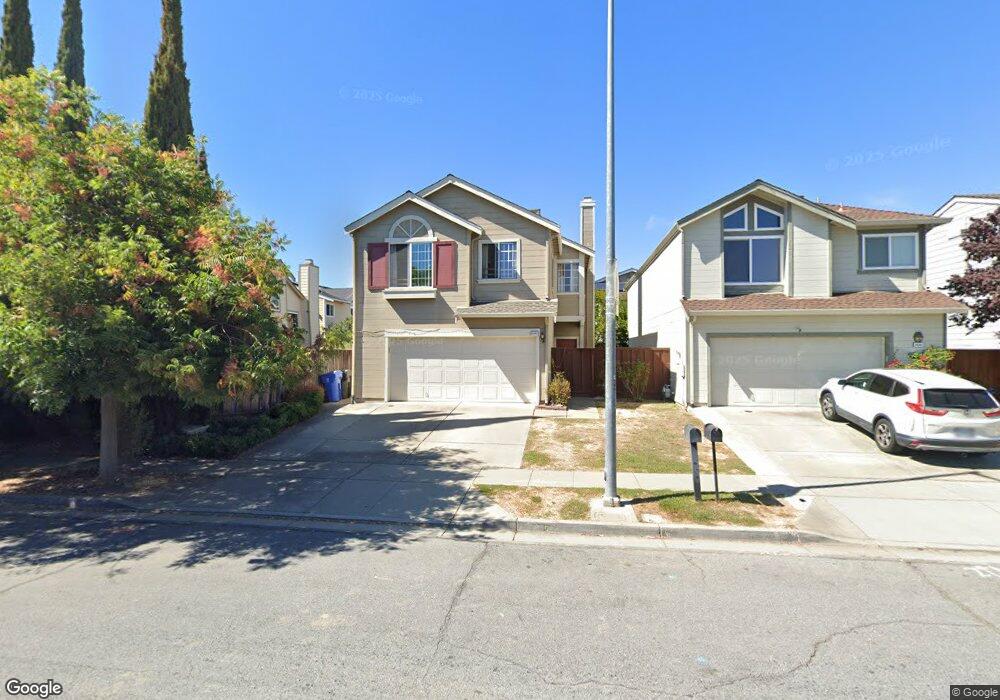
34347 Maybird Cir Fremont, CA 94555
Ardenwood NeighborhoodEstimated Value: $1,763,557 - $1,888,000
4
Beds
3
Baths
1,932
Sq Ft
$959/Sq Ft
Est. Value
About This Home
This home is located at 34347 Maybird Cir, Fremont, CA 94555 and is currently estimated at $1,852,139, approximately $958 per square foot. 34347 Maybird Cir is a home located in Alameda County with nearby schools including Forest Park Elementary, Thornton Middle School, and American High School.
Ownership History
Date
Name
Owned For
Owner Type
Purchase Details
Closed on
Aug 30, 2018
Sold by
Ni Wu Yonghui and Ni Li
Bought by
Ni Wu Yonghui and Ni Li
Current Estimated Value
Purchase Details
Closed on
Aug 6, 2012
Sold by
Menon Harikumar J and Nair Sanjana
Bought by
Ni Wu Yonghui and Ni Li
Home Financials for this Owner
Home Financials are based on the most recent Mortgage that was taken out on this home.
Original Mortgage
$542,981
Outstanding Balance
$86,838
Interest Rate
3.62%
Mortgage Type
New Conventional
Estimated Equity
$1,765,301
Purchase Details
Closed on
Nov 6, 1997
Sold by
Afsari Gholam Reza and Le My
Bought by
Menon Harikumar J and Nair Sanjana
Home Financials for this Owner
Home Financials are based on the most recent Mortgage that was taken out on this home.
Original Mortgage
$264,000
Interest Rate
7.75%
Purchase Details
Closed on
Aug 1, 1995
Sold by
Afsari Gholam Reza and Afsari Le My
Bought by
Afsari Gholam Reza and Afsari Le My
Home Financials for this Owner
Home Financials are based on the most recent Mortgage that was taken out on this home.
Original Mortgage
$232,000
Interest Rate
7.25%
Create a Home Valuation Report for This Property
The Home Valuation Report is an in-depth analysis detailing your home's value as well as a comparison with similar homes in the area
Home Values in the Area
Average Home Value in this Area
Purchase History
| Date | Buyer | Sale Price | Title Company |
|---|---|---|---|
| Ni Wu Yonghui | -- | None Available | |
| Ni Wu Yonghui | $724,000 | Chicago Title Company | |
| Menon Harikumar J | $330,000 | Old Republic Title Company | |
| Afsari Gholam Reza | -- | Old Republic Title Company |
Source: Public Records
Mortgage History
| Date | Status | Borrower | Loan Amount |
|---|---|---|---|
| Open | Ni Wu Yonghui | $542,981 | |
| Previous Owner | Menon Harikumar J | $264,000 | |
| Previous Owner | Afsari Gholam Reza | $232,000 | |
| Closed | Menon Harikumar J | $66,000 |
Source: Public Records
Tax History Compared to Growth
Tax History
| Year | Tax Paid | Tax Assessment Tax Assessment Total Assessment is a certain percentage of the fair market value that is determined by local assessors to be the total taxable value of land and additions on the property. | Land | Improvement |
|---|---|---|---|---|
| 2025 | $10,721 | $891,395 | $267,418 | $623,977 |
| 2024 | $10,721 | $873,920 | $262,176 | $611,744 |
| 2023 | $10,436 | $856,785 | $257,035 | $599,750 |
| 2022 | $10,303 | $839,991 | $251,997 | $587,994 |
| 2021 | $10,051 | $823,522 | $247,056 | $576,466 |
| 2020 | $10,086 | $815,081 | $244,524 | $570,557 |
| 2019 | $9,972 | $799,105 | $239,731 | $559,374 |
| 2018 | $9,696 | $783,440 | $235,032 | $548,408 |
| 2017 | $9,453 | $768,078 | $230,423 | $537,655 |
| 2016 | $9,293 | $753,021 | $225,906 | $527,115 |
| 2015 | $9,170 | $741,714 | $222,514 | $519,200 |
| 2014 | $9,012 | $727,185 | $218,155 | $509,030 |
Source: Public Records
Map
Nearby Homes
- 5220 Fairbanks Common
- 34648 Musk Terrace
- 5301 Shamrock Common
- 5308 Tacoma Common
- 5176 Tacoma Common
- 34565 Pueblo Terrace
- 34607 Pueblo Terrace
- 34198 Tony Terrace
- 34771 Tuxedo Common Unit 52
- 34627 Pueblo Terrace
- 34768 Swain Common
- 5621 Via Lugano
- 34192 Firenze Terrace
- 6004 Pisa Terrace Unit 119
- 6003 Milano Terrace Unit 14
- 4512 Macbeth Ave
- 34579 Bluestone Common
- 5303 Stirling Ct
- 34656 Greenstone Common
- 33018 Soquel St
- 34341 Maybird Cir
- 34348 Platinum Terrace
- 34340 Platinum Terrace
- 34361 Zircon Terrace
- 34335 Maybird Cir
- 34332 Platinum Terrace
- 34329 Maybird Cir
- 34324 Platinum Terrace
- 34353 Zircon Terrace
- 34316 Platinum Terrace
- 34323 Maybird Cir
- 34345 Zircon Terrace
- 34364 Zircon Terrace
- 34308 Platinum Terrace
- 34353 Maybird Cir
- 34356 Zircon Terrace
- 34317 Maybird Cir
- 34348 Zircon Terrace
- 34335 Platinum Terrace
- 34359 Maybird Cir