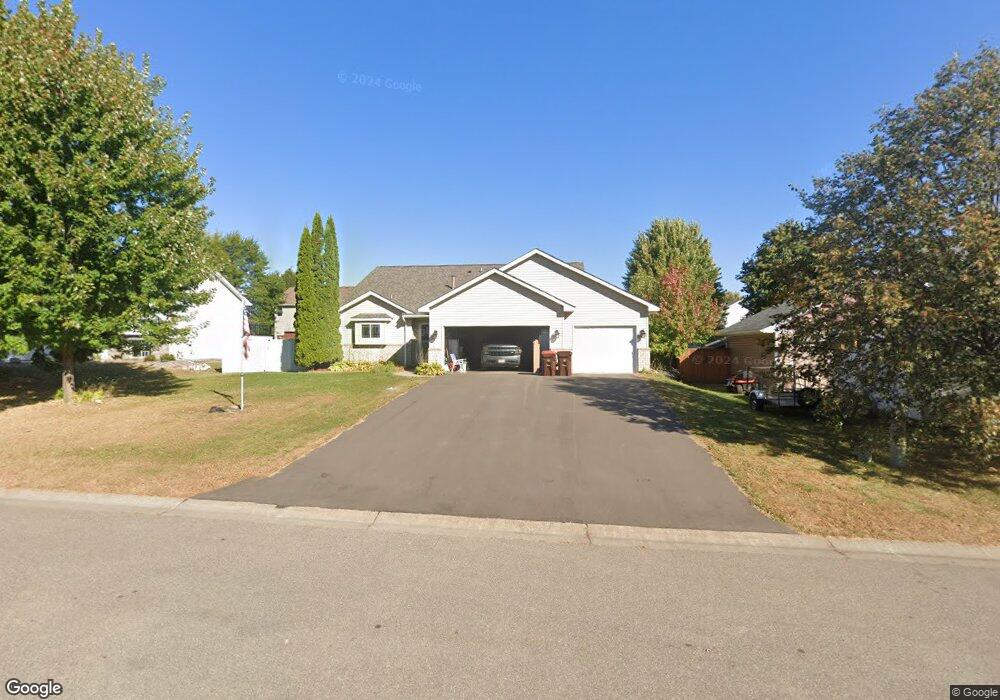
3435 White Oaks Ln Woodbury, MN 55125
Estimated Value: $457,000 - $469,000
4
Beds
3
Baths
2,276
Sq Ft
$203/Sq Ft
Est. Value
About This Home
This home is located at 3435 White Oaks Ln, Woodbury, MN 55125 and is currently estimated at $462,985, approximately $203 per square foot. 3435 White Oaks Ln is a home located in Washington County with nearby schools including Red Rock Elementary School, Woodbury Middle School, and Woodbury Senior High School.
Ownership History
Date
Name
Owned For
Owner Type
Purchase Details
Closed on
Jul 8, 2019
Sold by
Betland Mary Jo and Betland Robin
Bought by
Moore Sarah and Moore Michael
Current Estimated Value
Home Financials for this Owner
Home Financials are based on the most recent Mortgage that was taken out on this home.
Original Mortgage
$330,404
Outstanding Balance
$292,818
Interest Rate
4.4%
Mortgage Type
FHA
Estimated Equity
$170,167
Purchase Details
Closed on
May 9, 2012
Sold by
Carrier John Paul
Bought by
Carrier Mary Jo
Purchase Details
Closed on
Oct 15, 1998
Sold by
Twete Todd and Twete Brenda
Bought by
Carrier John P and Carrier Mary Jo
Purchase Details
Closed on
Oct 3, 1997
Sold by
Alpha Omega Homes and Nordvik Michael J
Bought by
Twete Todd M and Twete Brenda L
Purchase Details
Closed on
Nov 15, 1996
Sold by
Lyman Development
Bought by
Alpha Omega Homes Inc
Create a Home Valuation Report for This Property
The Home Valuation Report is an in-depth analysis detailing your home's value as well as a comparison with similar homes in the area
Home Values in the Area
Average Home Value in this Area
Purchase History
| Date | Buyer | Sale Price | Title Company |
|---|---|---|---|
| Moore Sarah | $336,500 | Edina Realty Title Inc | |
| Carrier Mary Jo | -- | None Available | |
| Carrier John P | $172,500 | -- | |
| Twete Todd M | $159,900 | -- | |
| Alpha Omega Homes Inc | $34,105 | -- |
Source: Public Records
Mortgage History
| Date | Status | Borrower | Loan Amount |
|---|---|---|---|
| Open | Moore Sarah | $330,404 |
Source: Public Records
Tax History Compared to Growth
Tax History
| Year | Tax Paid | Tax Assessment Tax Assessment Total Assessment is a certain percentage of the fair market value that is determined by local assessors to be the total taxable value of land and additions on the property. | Land | Improvement |
|---|---|---|---|---|
| 2024 | $5,440 | $425,800 | $135,000 | $290,800 |
| 2023 | $5,440 | $451,900 | $170,000 | $281,900 |
| 2022 | $4,600 | $414,200 | $147,000 | $267,200 |
| 2021 | $4,510 | $347,600 | $122,500 | $225,100 |
| 2020 | $4,490 | $344,800 | $127,500 | $217,300 |
| 2019 | $4,618 | $336,900 | $117,500 | $219,400 |
| 2018 | $4,518 | $317,200 | $112,500 | $204,700 |
| 2017 | $3,878 | $305,600 | $110,000 | $195,600 |
| 2016 | $3,978 | $283,200 | $90,000 | $193,200 |
| 2015 | $3,434 | $258,000 | $81,000 | $177,000 |
| 2013 | -- | $231,400 | $66,200 | $165,200 |
Source: Public Records
Map
Nearby Homes
- 3325 White Oaks Ln
- 3121 Copper Oaks Trail
- 3104 Copper Oaks Draw
- 3448 Churchill Dr
- 3090 Copper Oaks Draw
- 7608 Newbury Rd
- 8019 Marsh Creek Rd
- 7062 Sherwood Rd
- 7582 Ojibway Park Rd
- 7021 Waterstone Ln
- 7965 Forest Blvd Unit C
- 7140 Newbury Place
- 4030 Arbor Dr
- 4036 Arbor Dr
- 4000 Arbor Dr
- 4048 Arbor Dr
- 7146 Newbury Place
- 4145 Gable Ct
- 4029 Arbor Dr
- 2781 Robinwood Way
- 3445 White Oaks Ln
- 3395 Hartford Rd
- 3385 Hartford Rd
- 3405 Hartford Rd
- 3455 White Oaks Ln
- 3415 White Oaks Ln
- 3434 White Oaks Ln
- 3444 White Oaks Ln
- 3424 White Oaks Ln
- 3415 Hartford Rd
- 3465 White Oaks Ln
- 3454 White Oaks Ln
- 3375 Hartford Rd
- 3405 White Oaks Ln
- 3414 White Oaks Ln
- 3425 Hartford Rd
- 3360 Hartford Rd
- 3464 White Oaks Ln
- 3466 Commonwealth Ave
- 3853 Oxford Dr