Estimated Value: $320,000 - $385,172
3
Beds
1
Bath
1,205
Sq Ft
$297/Sq Ft
Est. Value
About This Home
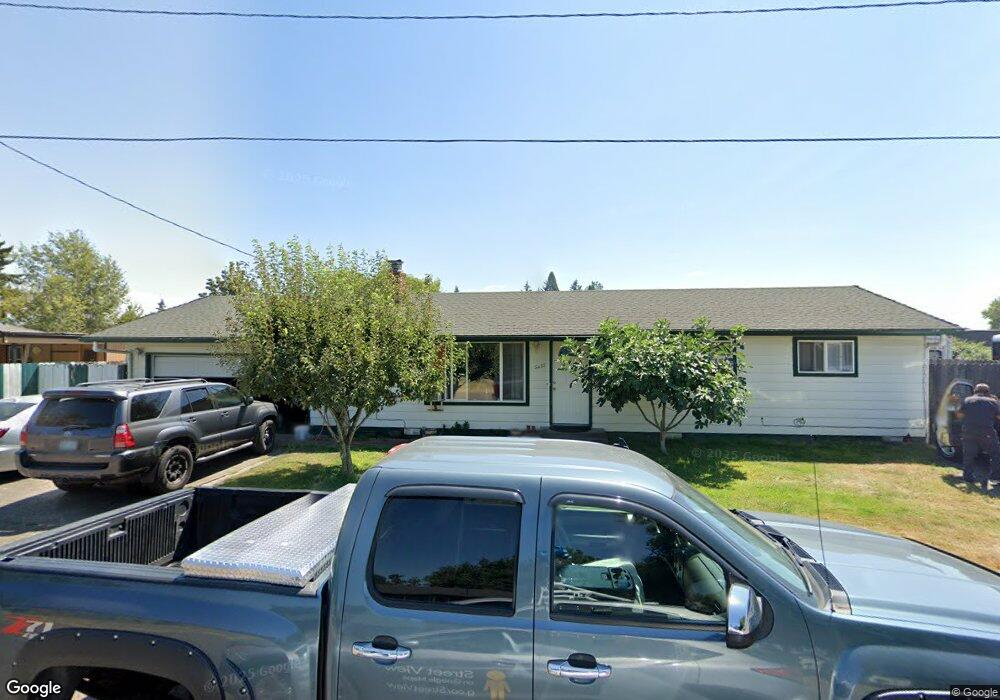
This home is located at 3437 C St, Springfield, OR 97478 and is currently estimated at $357,293, approximately $296 per square foot. 3437 C St is a home located in Lane County with nearby schools including Riverbend Elementary School, Briggs Middle School, and Thurston High School.
Ownership History
Date
Name
Owned For
Owner Type
Purchase Details
Closed on
Feb 12, 2020
Sold by
Delgado Enrique Carlos
Bought by
Delgado Enrique Carlos and Mateo Omar Carlos
Current Estimated Value
Purchase Details
Closed on
Jan 7, 2010
Sold by
Carlos Enrique D and Mateo Marta A
Bought by
Carlos Enrique D and Mateo Martha A
Home Financials for this Owner
Home Financials are based on the most recent Mortgage that was taken out on this home.
Original Mortgage
$110,000
Outstanding Balance
$71,559
Interest Rate
4.77%
Mortgage Type
New Conventional
Estimated Equity
$285,734
Create a Home Valuation Report for This Property
The Home Valuation Report is an in-depth analysis detailing your home's value as well as a comparison with similar homes in the area
Home Values in the Area
Average Home Value in this Area
Purchase History
| Date | Buyer | Sale Price | Title Company |
|---|---|---|---|
| Delgado Enrique Carlos | -- | Cascade Title Co | |
| Carlos Enrique D | -- | Cascade Title Co |
Source: Public Records
Mortgage History
| Date | Status | Borrower | Loan Amount |
|---|---|---|---|
| Open | Carlos Enrique D | $110,000 |
Source: Public Records
Tax History Compared to Growth
Tax History
| Year | Tax Paid | Tax Assessment Tax Assessment Total Assessment is a certain percentage of the fair market value that is determined by local assessors to be the total taxable value of land and additions on the property. | Land | Improvement |
|---|---|---|---|---|
| 2024 | $3,192 | $171,757 | -- | -- |
| 2023 | $3,192 | $166,755 | $0 | $0 |
| 2022 | $2,956 | $161,899 | $0 | $0 |
| 2021 | $2,903 | $157,184 | $0 | $0 |
| 2020 | $2,818 | $152,606 | $0 | $0 |
| 2019 | $2,733 | $148,162 | $0 | $0 |
| 2018 | $2,577 | $139,657 | $0 | $0 |
| 2017 | $2,478 | $139,657 | $0 | $0 |
| 2016 | $2,426 | $135,589 | $0 | $0 |
| 2015 | $2,356 | $131,640 | $0 | $0 |
| 2014 | $2,321 | $127,806 | $0 | $0 |
Source: Public Records
Map
Nearby Homes