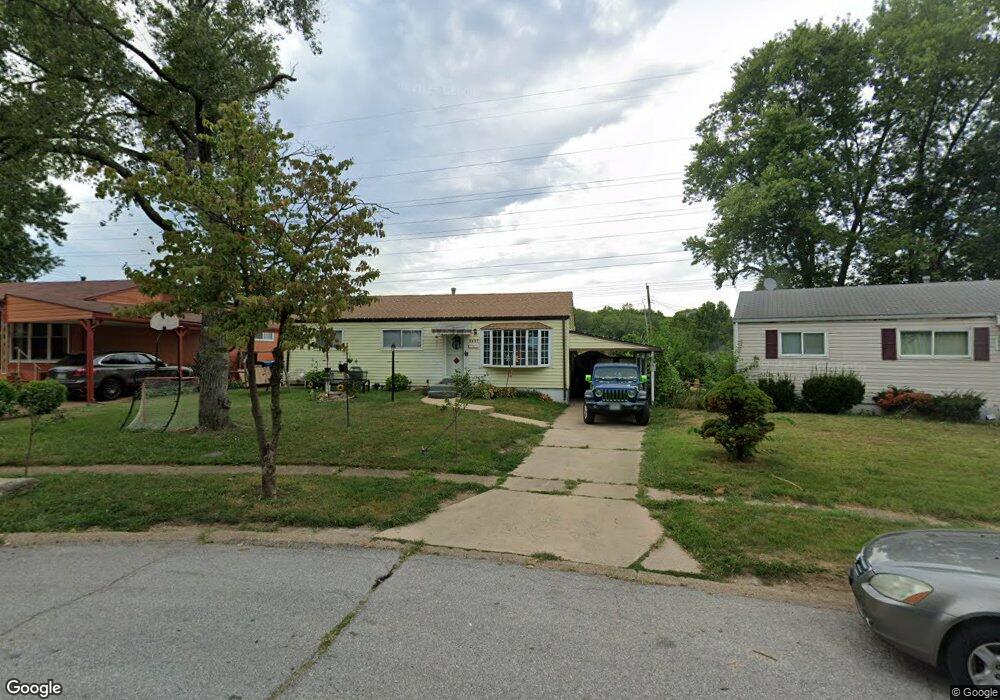
3437 Ranch Ln Saint Louis, MO 63121
Estimated Value: $87,344 - $111,000
3
Beds
1
Bath
1,000
Sq Ft
$100/Sq Ft
Est. Value
About This Home
This home is located at 3437 Ranch Ln, Saint Louis, MO 63121 and is currently estimated at $100,336, approximately $100 per square foot. 3437 Ranch Ln is a home located in St. Louis County with nearby schools including Normandy High School, Our Lady Of Guadalupe School, and Lutheran North Middle & High School.
Ownership History
Date
Name
Owned For
Owner Type
Purchase Details
Closed on
Jun 26, 2017
Sold by
Tope Properties Llc
Bought by
Brock Gordon C and Brock Georgia M
Current Estimated Value
Home Financials for this Owner
Home Financials are based on the most recent Mortgage that was taken out on this home.
Original Mortgage
$55,967
Outstanding Balance
$28,951
Interest Rate
3.62%
Mortgage Type
FHA
Estimated Equity
$71,385
Purchase Details
Closed on
May 1, 2006
Sold by
The Cit Group/Consumer Finance Inc
Bought by
Tope Properties Llc
Purchase Details
Closed on
Oct 12, 2005
Sold by
Landess Thomas L
Bought by
The Cit Group/Consumer Finance Inc
Purchase Details
Closed on
Apr 30, 1999
Sold by
Hagler Nancy K and Koch Nancy Koch
Bought by
Landess Thomas L
Home Financials for this Owner
Home Financials are based on the most recent Mortgage that was taken out on this home.
Original Mortgage
$54,125
Interest Rate
6.99%
Create a Home Valuation Report for This Property
The Home Valuation Report is an in-depth analysis detailing your home's value as well as a comparison with similar homes in the area
Home Values in the Area
Average Home Value in this Area
Purchase History
| Date | Buyer | Sale Price | Title Company |
|---|---|---|---|
| Brock Gordon C | $57,000 | Vision Title Llc E | |
| Tope Properties Llc | $48,100 | None Available | |
| The Cit Group/Consumer Finance Inc | $68,880 | -- | |
| Landess Thomas L | $49,250 | Nations Title Agency Inc |
Source: Public Records
Mortgage History
| Date | Status | Borrower | Loan Amount |
|---|---|---|---|
| Open | Brock Gordon C | $55,967 | |
| Previous Owner | Landess Thomas L | $54,125 |
Source: Public Records
Tax History Compared to Growth
Tax History
| Year | Tax Paid | Tax Assessment Tax Assessment Total Assessment is a certain percentage of the fair market value that is determined by local assessors to be the total taxable value of land and additions on the property. | Land | Improvement |
|---|---|---|---|---|
| 2025 | $1,284 | $15,700 | $2,360 | $13,340 |
| 2024 | $1,284 | $13,380 | $2,740 | $10,640 |
| 2023 | $1,304 | $13,380 | $2,740 | $10,640 |
| 2022 | $998 | $8,800 | $1,560 | $7,240 |
| 2021 | $969 | $8,800 | $1,560 | $7,240 |
| 2020 | $874 | $7,760 | $1,580 | $6,180 |
| 2019 | $861 | $7,760 | $1,580 | $6,180 |
| 2018 | $1,050 | $8,990 | $1,240 | $7,750 |
| 2017 | $1,037 | $8,990 | $1,240 | $7,750 |
| 2016 | $986 | $8,080 | $1,620 | $6,460 |
| 2015 | $968 | $8,080 | $1,620 | $6,460 |
| 2014 | $890 | $7,080 | $1,460 | $5,620 |
Source: Public Records
Map
Nearby Homes
- 8950 Higginson Dr
- 8922 Higginson Dr
- 3436 Saint Henry Ln
- 8836 Ramona Ave
- 8601 Wales Rd
- 8950 Natural Bridge Rd
- 8705 Kendale Dr
- 3213 Werder Dr
- 2937 N Hanley Rd
- 2965 Kincaid Ave
- 2920 N Hanley Rd
- 495 Ginger Dr
- 493 Ginger Dr
- 2831 Old Hanley Rd
- 2918 Ridgeway Ave
- 2820 Old Hanley Rd
- 2915 Ridgeway Ave
- 4004 Engler Ave
- 7619 Chorman Ave
- 9163 Loganberry Ln