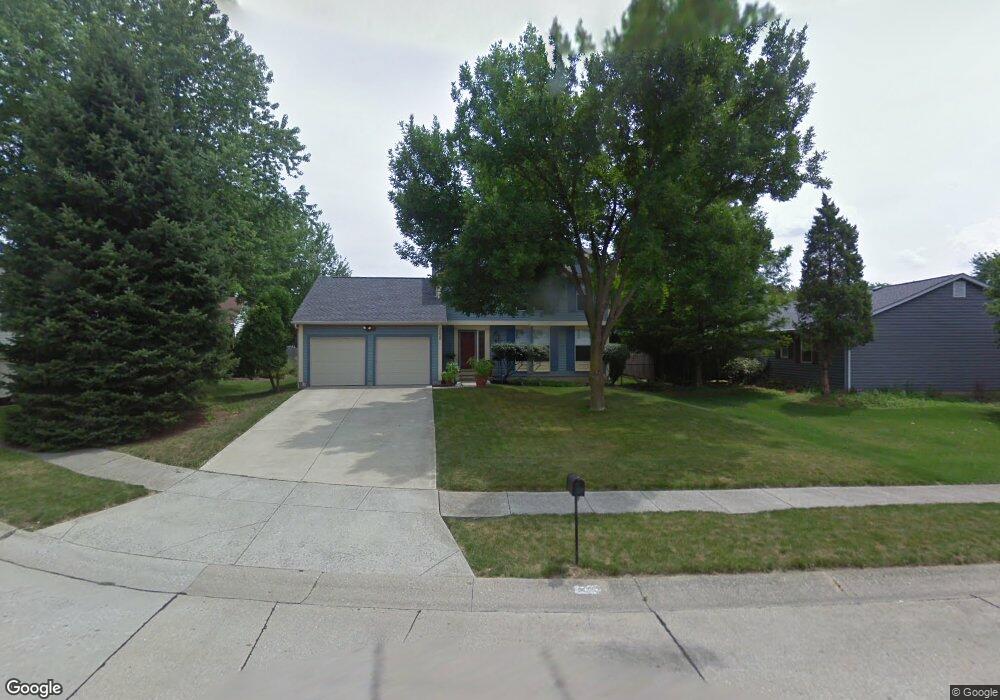
3438 Furrow Ct Canal Winchester, OH 43110
Estimated Value: $282,073 - $304,000
3
Beds
2
Baths
1,500
Sq Ft
$193/Sq Ft
Est. Value
About This Home
This home is located at 3438 Furrow Ct, Canal Winchester, OH 43110 and is currently estimated at $289,268, approximately $192 per square foot. 3438 Furrow Ct is a home located in Franklin County with nearby schools including Groveport Madison High School, A+ Arts Academy, and Brice Christian Academy Elementary School.
Ownership History
Date
Name
Owned For
Owner Type
Purchase Details
Closed on
Nov 12, 1987
Bought by
Lenston Larry T
Current Estimated Value
Purchase Details
Closed on
Jul 31, 1987
Purchase Details
Closed on
Oct 1, 1983
Create a Home Valuation Report for This Property
The Home Valuation Report is an in-depth analysis detailing your home's value as well as a comparison with similar homes in the area
Home Values in the Area
Average Home Value in this Area
Purchase History
| Date | Buyer | Sale Price | Title Company |
|---|---|---|---|
| Lenston Larry T | $79,200 | -- | |
| -- | $14,000 | -- | |
| -- | -- | -- |
Source: Public Records
Tax History Compared to Growth
Tax History
| Year | Tax Paid | Tax Assessment Tax Assessment Total Assessment is a certain percentage of the fair market value that is determined by local assessors to be the total taxable value of land and additions on the property. | Land | Improvement |
|---|---|---|---|---|
| 2024 | $3,210 | $85,510 | $23,630 | $61,880 |
| 2023 | $3,206 | $85,510 | $23,630 | $61,880 |
| 2022 | $1,919 | $46,760 | $8,400 | $38,360 |
| 2021 | $1,925 | $46,760 | $8,400 | $38,360 |
| 2020 | $1,928 | $46,760 | $8,400 | $38,360 |
| 2019 | $1,687 | $38,500 | $7,000 | $31,500 |
| 2018 | $1,628 | $38,500 | $7,000 | $31,500 |
| 2017 | $1,622 | $38,500 | $7,000 | $31,500 |
| 2016 | $1,542 | $33,360 | $7,670 | $25,690 |
| 2015 | $1,558 | $33,360 | $7,670 | $25,690 |
| 2014 | $1,576 | $33,360 | $7,670 | $25,690 |
| 2013 | $660 | $33,355 | $7,665 | $25,690 |
Source: Public Records
Map
Nearby Homes
- 3471 Treehouse Ln
- 6286 Stoney Glenn Ct
- 6167 Kensington Glen Dr
- 5978 Abernathy Ln
- 5976 Abernathy Ln
- 5970 Abernathy Ln
- 3000 High St
- 5968 Abernathy Ln
- 5962 Abernathy Ln
- 5969 Hollett Dr S
- 5960 Abernathy Ln
- 5993 Columbus St
- 5957 Hollett Dr S
- St Martin Plan at Chatterton Commons
- 3310 Joshstock Dr
- 3304 Joshstock Dr
- 3298 Joshstock Dr
- 5946 Abernathy Ln
- 5944 Abernathy Ln
- 5938 Abernathy Ln