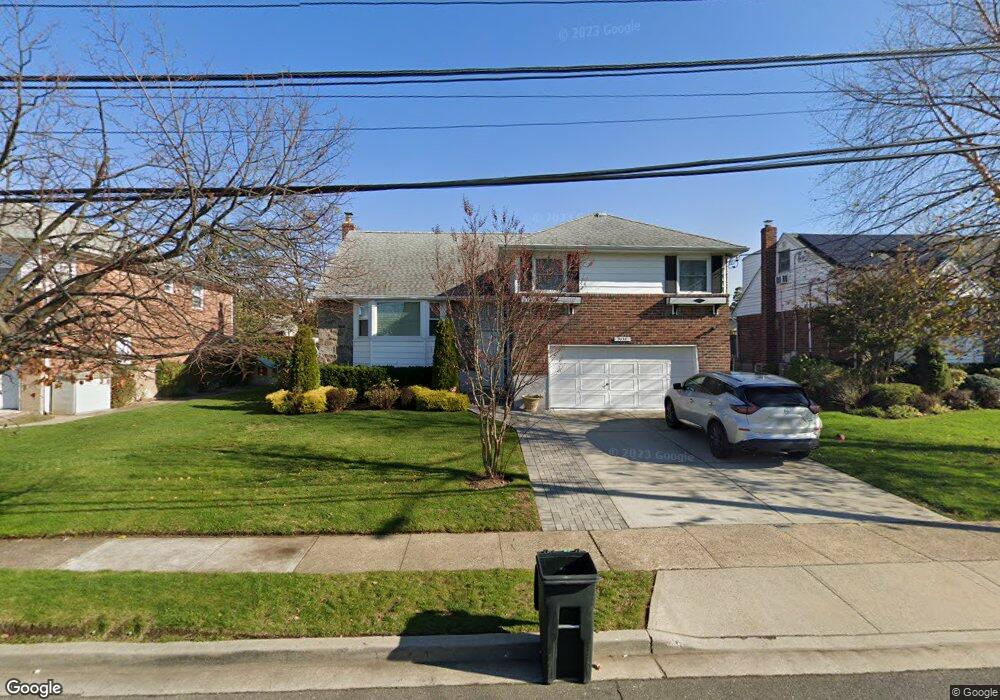
3439 Fairway Rd Oceanside, NY 11572
Estimated Value: $934,000 - $1,063,000
Studio
4
Baths
1,875
Sq Ft
$526/Sq Ft
Est. Value
About This Home
This home is located at 3439 Fairway Rd, Oceanside, NY 11572 and is currently estimated at $986,666, approximately $526 per square foot. 3439 Fairway Rd is a home located in Nassau County with nearby schools including Boardman Elementary School, Oceanside Middle School, and Oceanside High School.
Ownership History
Date
Name
Owned For
Owner Type
Purchase Details
Closed on
Jun 25, 2021
Sold by
Billingsley Merissa
Bought by
Lutz David and Lutz Ariella
Current Estimated Value
Home Financials for this Owner
Home Financials are based on the most recent Mortgage that was taken out on this home.
Original Mortgage
$639,200
Outstanding Balance
$574,921
Interest Rate
2.9%
Mortgage Type
New Conventional
Estimated Equity
$411,745
Purchase Details
Closed on
Jan 8, 2018
Sold by
Bernstein Samuel and Bernstien Phyliis
Bought by
Billingsley Merissa
Create a Home Valuation Report for This Property
The Home Valuation Report is an in-depth analysis detailing your home's value as well as a comparison with similar homes in the area
Home Values in the Area
Average Home Value in this Area
Purchase History
| Date | Buyer | Sale Price | Title Company |
|---|---|---|---|
| Lutz David | $799,000 | None Available | |
| Billingsley Merissa | $700,000 | None Available |
Source: Public Records
Mortgage History
| Date | Status | Borrower | Loan Amount |
|---|---|---|---|
| Open | Lutz David | $639,200 |
Source: Public Records
Tax History
| Year | Tax Paid | Tax Assessment Tax Assessment Total Assessment is a certain percentage of the fair market value that is determined by local assessors to be the total taxable value of land and additions on the property. | Land | Improvement |
|---|---|---|---|---|
| 2025 | $17,342 | $628 | $251 | $377 |
| 2024 | $4,710 | $598 | $239 | $359 |
| 2023 | $15,970 | $640 | $256 | $384 |
| 2022 | $15,970 | $628 | $251 | $377 |
| 2021 | $20,671 | $618 | $247 | $371 |
| 2020 | $13,602 | $800 | $596 | $204 |
| 2019 | $4,012 | $800 | $481 | $319 |
| 2018 | $8,870 | $800 | $0 | $0 |
| 2017 | $7,896 | $934 | $596 | $338 |
| 2016 | $12,170 | $934 | $596 | $338 |
| 2015 | $4,083 | $934 | $596 | $338 |
| 2014 | $4,083 | $934 | $596 | $338 |
| 2013 | $3,796 | $934 | $596 | $338 |
Source: Public Records
Map
Nearby Homes
- 3391 Fairway Rd
- 3461 Ocean Ave
- 348 Links Dr E
- 3452 Ocean Ave
- 243 Mott St
- 163 Mott St
- 3309 Skillman Ave
- 487 Links Dr E
- 512 Links Dr E
- 3251 Neptune Ave
- 3454 Woodward St
- 3451 3rd St
- 3432 Bayfield Blvd
- 3354 2nd St
- 3727 Oceanside Rd E
- 3195 Nantucket Ln
- 3354 Knight St
- 528 Carpenter Ave
- 3348 3rd St
- 30 Gifford Ave
Your Personal Tour Guide
Ask me questions while you tour the home.