Estimated Value: $170,096 - $302,000
4
Beds
4
Baths
2,204
Sq Ft
$109/Sq Ft
Est. Value
About This Home
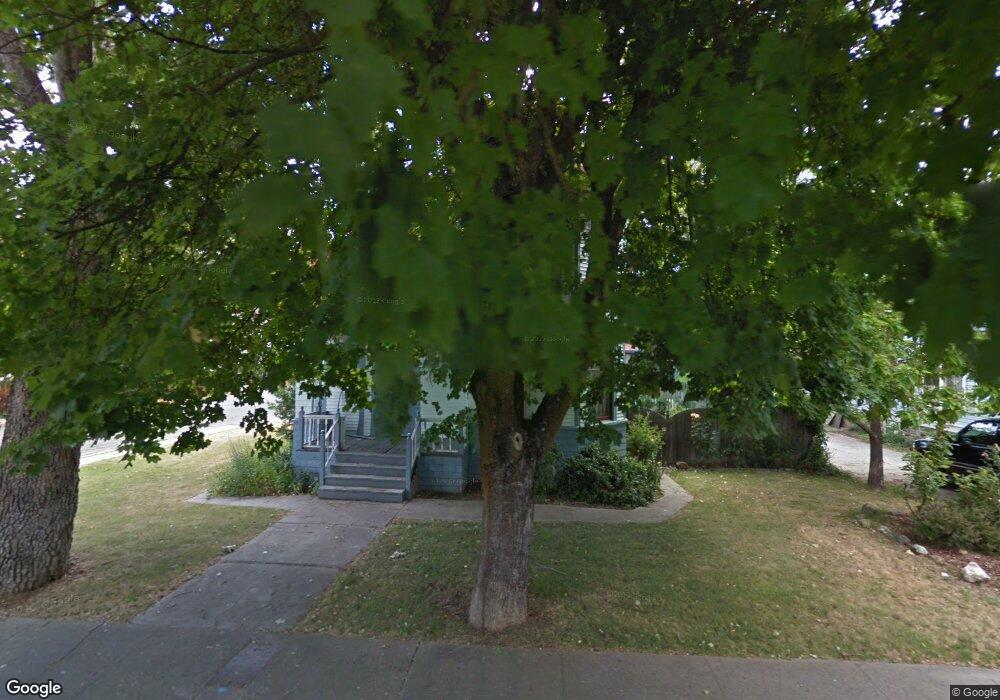
This home is located at 344 3rd St, Yreka, CA 96097 and is currently estimated at $241,274, approximately $109 per square foot. 344 3rd St is a home located in Siskiyou County with nearby schools including Evergreen Elementary School, Jackson Street Elementary School, and Yreka High School.
Ownership History
Date
Name
Owned For
Owner Type
Purchase Details
Closed on
Dec 6, 2010
Sold by
Larivee Dan P and Larivee Kelly A
Bought by
Hill Michelle Lynn and 1998 Michelle Hill Revocable T
Current Estimated Value
Home Financials for this Owner
Home Financials are based on the most recent Mortgage that was taken out on this home.
Original Mortgage
$50,000
Outstanding Balance
$32,950
Interest Rate
4.17%
Mortgage Type
Seller Take Back
Estimated Equity
$208,324
Purchase Details
Closed on
Mar 31, 2005
Sold by
Larivee Sharon
Bought by
Larivee Dan P and Christensen Kelly A
Home Financials for this Owner
Home Financials are based on the most recent Mortgage that was taken out on this home.
Original Mortgage
$195,000
Interest Rate
5.5%
Mortgage Type
Purchase Money Mortgage
Purchase Details
Closed on
Nov 7, 2001
Sold by
Smith Harold E and Smith Margie L
Bought by
Smith Harold E and Smith Margie L
Create a Home Valuation Report for This Property
The Home Valuation Report is an in-depth analysis detailing your home's value as well as a comparison with similar homes in the area
Home Values in the Area
Average Home Value in this Area
Purchase History
| Date | Buyer | Sale Price | Title Company |
|---|---|---|---|
| Hill Michelle Lynn | $65,000 | Mt Shasta Title & Escrow Co | |
| Larivee Dan P | -- | Siskiyou County Title Co | |
| Larivee Dan P | $270,000 | Siskiyou County Title Co | |
| Smith Harold E | -- | -- | |
| Smith Harold E | -- | -- |
Source: Public Records
Mortgage History
| Date | Status | Borrower | Loan Amount |
|---|---|---|---|
| Open | Hill Michelle Lynn | $50,000 | |
| Previous Owner | Larivee Dan P | $195,000 | |
| Previous Owner | Larivee Dan P | $48,000 |
Source: Public Records
Tax History
| Year | Tax Paid | Tax Assessment Tax Assessment Total Assessment is a certain percentage of the fair market value that is determined by local assessors to be the total taxable value of land and additions on the property. | Land | Improvement |
|---|---|---|---|---|
| 2025 | $853 | $83,267 | $36,847 | $46,420 |
| 2023 | $853 | $80,035 | $35,417 | $44,618 |
| 2022 | $821 | $78,467 | $34,723 | $43,744 |
| 2021 | $807 | $76,930 | $34,043 | $42,887 |
| 2020 | $802 | $76,142 | $33,694 | $42,448 |
| 2019 | $788 | $74,650 | $33,034 | $41,616 |
| 2018 | $773 | $73,187 | $32,387 | $40,800 |
| 2017 | $758 | $71,752 | $71,752 | $0 |
| 2016 | $741 | $70,346 | $70,346 | $0 |
| 2015 | $730 | $69,290 | $69,290 | $0 |
| 2014 | $703 | $67,933 | $67,933 | $0 |
Source: Public Records
Map
Nearby Homes
Your Personal Tour Guide
Ask me questions while you tour the home.