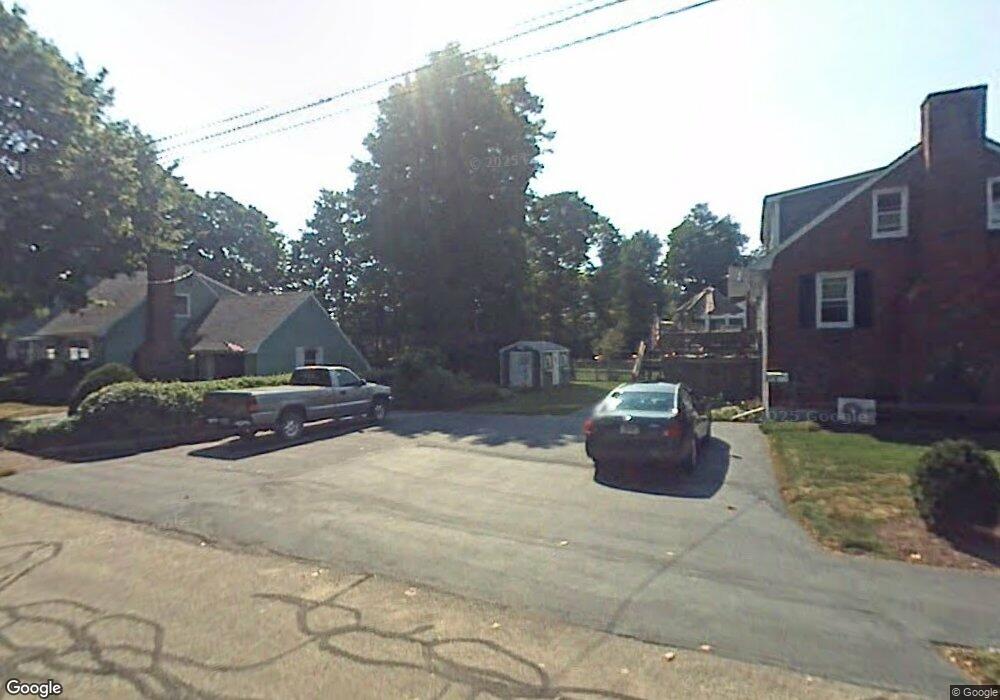
344 Albion St Wakefield, MA 01880
West Side NeighborhoodEstimated Value: $995,000 - $1,068,897
4
Beds
3
Baths
3,068
Sq Ft
$335/Sq Ft
Est. Value
About This Home
This home is located at 344 Albion St, Wakefield, MA 01880 and is currently estimated at $1,027,474, approximately $334 per square foot. 344 Albion St is a home located in Middlesex County with nearby schools including Wakefield Memorial High School, St Joseph School, and St. Patrick Elementary School.
Ownership History
Date
Name
Owned For
Owner Type
Purchase Details
Closed on
Mar 15, 2022
Sold by
Johnston Arthur R and Johnston Janet R
Bought by
344 Albion Street T
Current Estimated Value
Purchase Details
Closed on
Jun 20, 1989
Sold by
Rieger Grover C
Bought by
Johnston Arthur R
Create a Home Valuation Report for This Property
The Home Valuation Report is an in-depth analysis detailing your home's value as well as a comparison with similar homes in the area
Home Values in the Area
Average Home Value in this Area
Purchase History
| Date | Buyer | Sale Price | Title Company |
|---|---|---|---|
| 344 Albion Street T | -- | None Available | |
| Johnston Arthur R | $215,000 | -- | |
| Johnston Arthur R | $215,000 | -- |
Source: Public Records
Mortgage History
| Date | Status | Borrower | Loan Amount |
|---|---|---|---|
| Previous Owner | Johnston Arthur R | $200,000 | |
| Previous Owner | Johnston Arthur R | $180,000 | |
| Previous Owner | Johnston Arthur R | $52,000 |
Source: Public Records
Tax History Compared to Growth
Tax History
| Year | Tax Paid | Tax Assessment Tax Assessment Total Assessment is a certain percentage of the fair market value that is determined by local assessors to be the total taxable value of land and additions on the property. | Land | Improvement |
|---|---|---|---|---|
| 2025 | $9,983 | $879,600 | $331,500 | $548,100 |
| 2024 | $9,799 | $871,000 | $328,200 | $542,800 |
| 2023 | $9,297 | $792,600 | $298,100 | $494,500 |
| 2022 | $8,975 | $728,500 | $273,500 | $455,000 |
| 2021 | $8,099 | $636,200 | $246,900 | $389,300 |
| 2020 | $7,764 | $608,000 | $236,000 | $372,000 |
| 2019 | $7,358 | $573,500 | $222,600 | $350,900 |
| 2018 | $5,225 | $539,800 | $209,500 | $330,300 |
| 2017 | $6,795 | $521,500 | $202,400 | $319,100 |
| 2016 | $6,328 | $469,100 | $199,000 | $270,100 |
| 2015 | $6,036 | $447,800 | $189,700 | $258,100 |
| 2014 | $5,616 | $439,400 | $186,000 | $253,400 |
Source: Public Records
Map
Nearby Homes
- 5 Byron St
- 4 Vernon Ave
- 10 Converse St
- 97 Macarthur Rd
- 69 Foundry St Unit 416
- 69 Foundry St Unit 310
- 34 Duncklee Ave
- 106 Elm St
- 4 Adams St
- 62 Foundry St Unit 310
- 62 Foundry St Unit 312
- 62 Foundry St Unit 506
- 62 Foundry St Unit 202
- 62 Foundry St Unit 208
- 62 Foundry St Unit 414
- 62 Foundry St Unit 406
- 62 Foundry St Unit 313
- 59 Norval Ave
- Unit 208 Plan at Wrenly
- Unit 310 Plan at Wrenly