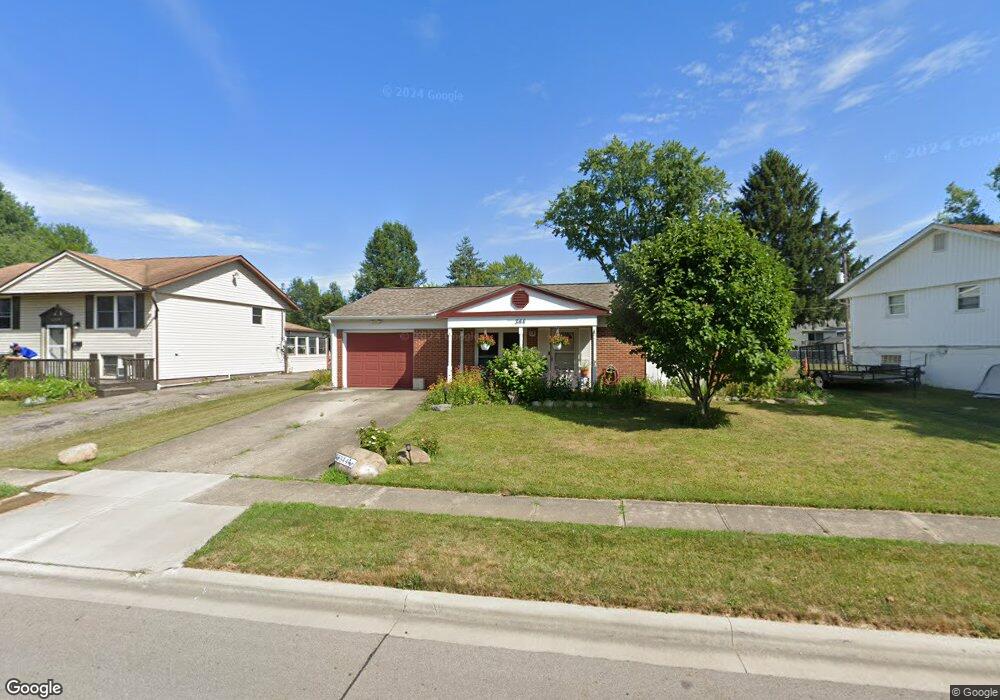
344 Canfield Dr Columbus, OH 43230
Estimated Value: $243,334 - $266,000
3
Beds
1
Bath
1,157
Sq Ft
$220/Sq Ft
Est. Value
About This Home
This home is located at 344 Canfield Dr, Columbus, OH 43230 and is currently estimated at $254,084, approximately $219 per square foot. 344 Canfield Dr is a home located in Franklin County with nearby schools including Royal Manor Elementary School, Gahanna West Middle School, and Lincoln High School.
Ownership History
Date
Name
Owned For
Owner Type
Purchase Details
Closed on
Aug 13, 2004
Sold by
Kent Daniel E and Kent Inez W
Bought by
Faber Jordana M
Current Estimated Value
Home Financials for this Owner
Home Financials are based on the most recent Mortgage that was taken out on this home.
Original Mortgage
$110,610
Outstanding Balance
$56,661
Interest Rate
6.5%
Mortgage Type
Purchase Money Mortgage
Estimated Equity
$197,423
Purchase Details
Closed on
Nov 22, 2000
Sold by
Herron Ronald K
Bought by
Kent Daniel E and Kent Inez W
Home Financials for this Owner
Home Financials are based on the most recent Mortgage that was taken out on this home.
Original Mortgage
$46,500
Interest Rate
7.7%
Purchase Details
Closed on
Dec 15, 1993
Bought by
Herron Ronald K
Purchase Details
Closed on
Jul 24, 1989
Purchase Details
Closed on
Sep 1, 1986
Create a Home Valuation Report for This Property
The Home Valuation Report is an in-depth analysis detailing your home's value as well as a comparison with similar homes in the area
Home Values in the Area
Average Home Value in this Area
Purchase History
| Date | Buyer | Sale Price | Title Company |
|---|---|---|---|
| Faber Jordana M | $122,900 | -- | |
| Kent Daniel E | $96,500 | Chicago Title West | |
| Herron Ronald K | -- | -- | |
| -- | $57,800 | -- | |
| -- | $49,500 | -- |
Source: Public Records
Mortgage History
| Date | Status | Borrower | Loan Amount |
|---|---|---|---|
| Open | Faber Jordana M | $110,610 | |
| Previous Owner | Kent Daniel E | $46,500 |
Source: Public Records
Tax History Compared to Growth
Tax History
| Year | Tax Paid | Tax Assessment Tax Assessment Total Assessment is a certain percentage of the fair market value that is determined by local assessors to be the total taxable value of land and additions on the property. | Land | Improvement |
|---|---|---|---|---|
| 2024 | $3,934 | $66,780 | $23,800 | $42,980 |
| 2023 | $3,885 | $66,780 | $23,800 | $42,980 |
| 2022 | $3,247 | $43,480 | $12,850 | $30,630 |
| 2021 | $3,140 | $43,480 | $12,850 | $30,630 |
| 2020 | $3,114 | $43,480 | $12,850 | $30,630 |
| 2019 | $2,636 | $36,720 | $10,710 | $26,010 |
| 2018 | $2,584 | $36,720 | $10,710 | $26,010 |
| 2017 | $2,484 | $36,720 | $10,710 | $26,010 |
| 2016 | $2,550 | $35,250 | $9,450 | $25,800 |
| 2015 | $2,552 | $35,250 | $9,450 | $25,800 |
| 2014 | $2,532 | $35,250 | $9,450 | $25,800 |
| 2013 | $1,257 | $35,245 | $9,450 | $25,795 |
Source: Public Records
Map
Nearby Homes
- 221 Lincolnshire Rd
- 463 Lincolnshire Rd
- 2741 Acarie Dr
- 4093 Adalric Dr
- 668 Kenilworth Ct
- 4131 Claver Dr
- 343 Imperial Dr
- 2851 Acarie Dr
- 2694 Kantian Dr
- 470 Deerwood Ave E
- 209 Imperial Dr
- 600 Agler Rd
- 404 Foxwood Dr
- 3888 Agler Rd
- 0 Stelzer Rd Unit L 225022351
- 464 Foxwood Dr
- 3610 N Stygler Rd
- 3877 Hines Rd
- 3784 Armuth Ave
- 2423 Stelzer Rd
- 350 Canfield Dr
- 340 Canfield Dr
- 331 Lincolnshire Rd
- 325 Lincolnshire Rd
- 328 Amesbury Dr
- 356 Canfield Dr
- 335 Lincolnshire Rd
- 353 Canfield Dr
- 321 Lincolnshire Rd
- 343 Canfield Dr
- 339 Lincolnshire Rd
- 361 Canfield Dr
- 360 Canfield Dr
- 362 Banbury Dr
- 337 Canfield Dr
- 367 Canfield Dr
- 323 Amesbury Dr
- 351 Banbury Dr
- 313 Lincolnshire Rd
- 368 Banbury Dr